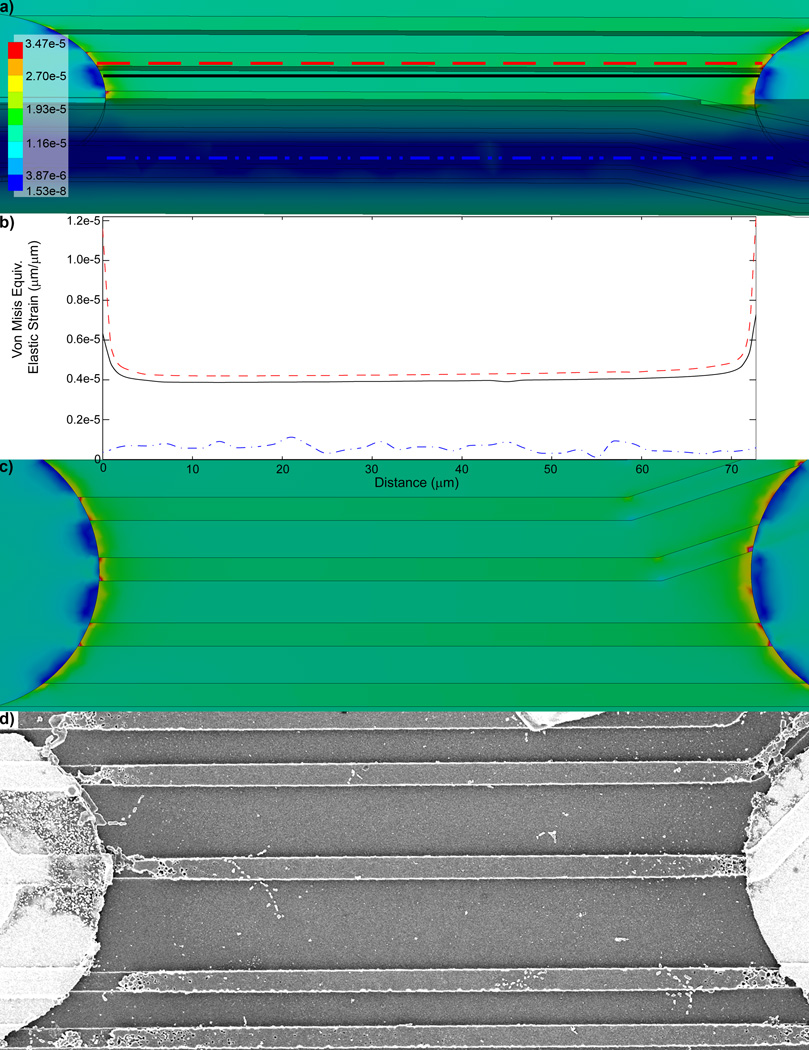
Figure 3.
Von Mises Equivalent Elastic Strain (µm/µm) between recording sites. a) Strain distribution in a cross-section of the probe. The strain is the lowest in the interior of the probe and greatest on the protruding traces. Scale bar = 100 µm. Red dashed line, black solid line, and blue dash done line indicate the location in which strain was measured for (b). b) Von Mises Equivalent Elastic Strain (µm/µm) between the 5th and 6th recording sites; at the surface of the electrical trace structure (red dashed line), at the surface of the substrate next to a trace (black solid line), and inside probe at the middle of the substrate (blue dash dot line). c) Von Mises Equivalent Elastic Strain (µm/µm). d) SEM of a trace between the 5th and 6th recording site of a probe explanted 189 days after implantation shows structural degradation and fracturing of protruding traces near the edges of the iridium recording sites (Fig. S4).

