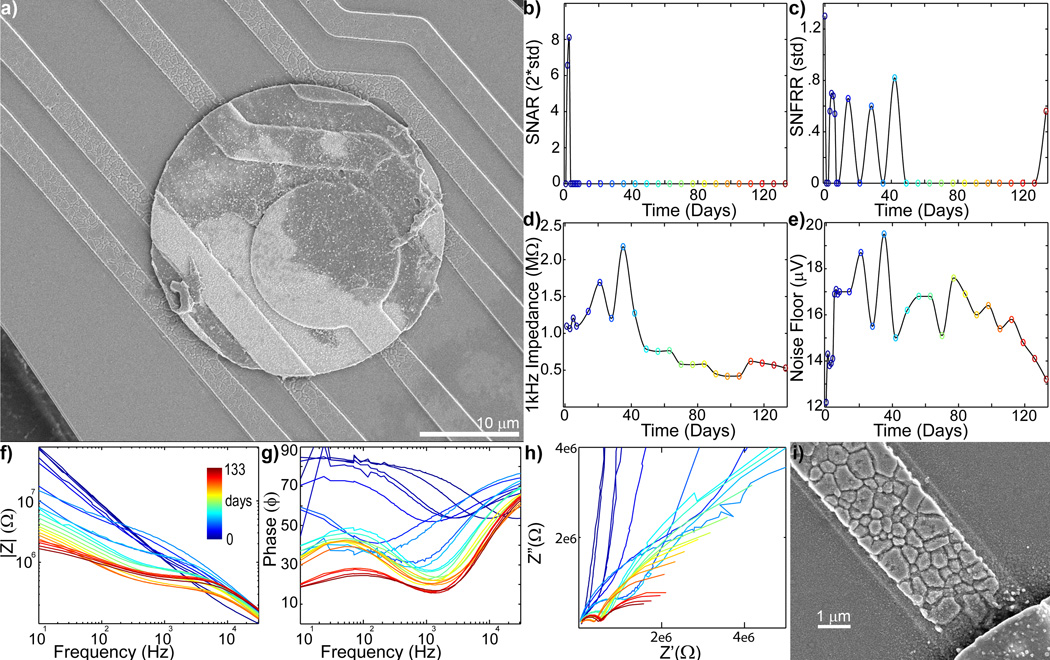
Figure 5.
b) Chronic in vivo electrode failure can cause a decrease in impedance (day 0 = blue to day 133 = red: recording site #6 of Fig S1). a) SEM shows degradation of the electrical trace around the edge of the recording site. Drop in SU SNAR (b) and MU SNFRR (c) recording coincides with the large jump in impedance (d) on day 35, followed by a large drop starting on day 42. Dramatic shifts in Bode Magnitude (f), Bode Phase (g), and Nyquist (h) plots can also be observed at this time point. Noisy (jagged) curves in the Bode Phase and Nyquist plot on day 35 indicates a break in the electrical circuit. The subsequent smooth curves suggest the remaining intact electrical trace became de-insulated. i) Zoomed in SEM of eroded electrical trace.

