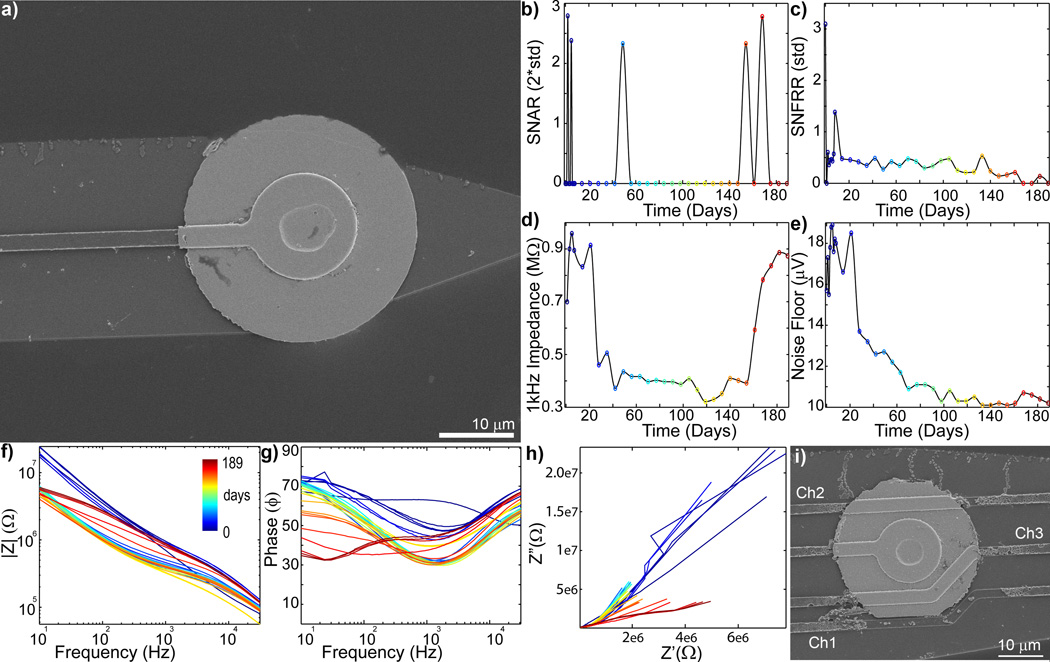
Figure 6.
Complex chronic in vivo electrode failure when the trace around the recording site is intact. (day 0 = blue to day 189 = red: recording site #1 of Fig. S4). a) SEM of recording site #1 shows the trace is intact. b) SU SNAR is limited between days 14 and 147. c) MU SNFRR shows significant (p>0.05) evoked activity until day 168. d) Impedance dramatically drops between days 14 to 28 then dramatically increases between days 154 to 168. e) Noise floor largely drops between days 14 to 28, then slow decreases until day 98, and then slightly increases on day 168. f) Body Magnitude (|Z|) plot shows only the high frequency impedance drop on day 14. That is followed by a decrease in impedance across all frequencies, and then and increase in impedance across all frequencies starting on day 175. g) Similarly, large shifts in the Bode Phase plot can been observed on day 14 and day 175. h) Nyquist plot (Z’ vs Z”) shows a dramatic decrease in reactance (Z”) and resistance (Z’) on day 14, then an increase in resistance from day 147 to 175. i) SEM of recording site #4 shows degradation of the electrical trace from recording site #1.

