Figure 7.
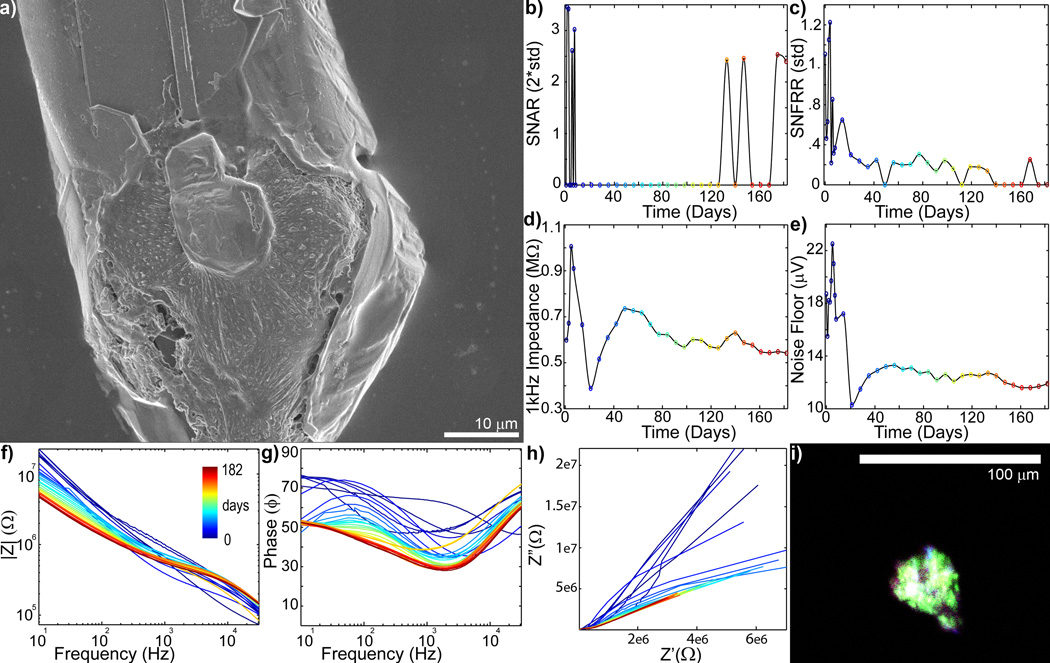
Complex chronic in vivo electrode failure and low level recovery when electrode failure is accompanied by glial encapsulation (day 0 = blue to day 182 = red: recording site #1 of Fig S2). a) SEM of recording site shows substantial cellular encapsulation. b) SU SNAR is lost after the first week, but sporadically returns starting on day 126. c) MU SNFRR dramatically decreases after the first week, and then degrades around day 133–140. d) 1kHz Impedance greatly increases over the first week, then drops over the following two weeks. It then gradually increases between days 28 to 49, and then slowly decreases over the remainder of the implant period. e) Noise Floor, similarly, increases over the first week, and drops between days 7 and 21. This is followed by a gradual increase between days 28 to 49. f) Bode Magnitude (|Z|) shows only the higher frequencies (>200 Hz) increased on day 5 and 7 and decreased on day 8. This was followed by a decrease across most frequencies (<4 kHz) on day 14. Impedance recovered between day 28 and 49, then preferentially decreased over the lower frequencies over the remaining implant period. g) Bode Phase (Phase) shows large changes over the first 7 weeks, followed by a slow resistive shift. h) Nyquist (Z’ vs Z”) plot shows limited RC (charge transfer) arc typically expected from glial encapsulated recording sites. i) Immunohistochemistry [Iba1 (Green), Vimentin (Red), IgG (Blue), Hoechst (White)] shows that the cellular encapsulation is glial. A complex relationship between gliosis and insulation failure may lead to low level functionality. Glial encapsulation occurring with trace de-insulation failure may be difficult to identify from Bode and Nyquist plots alone.

