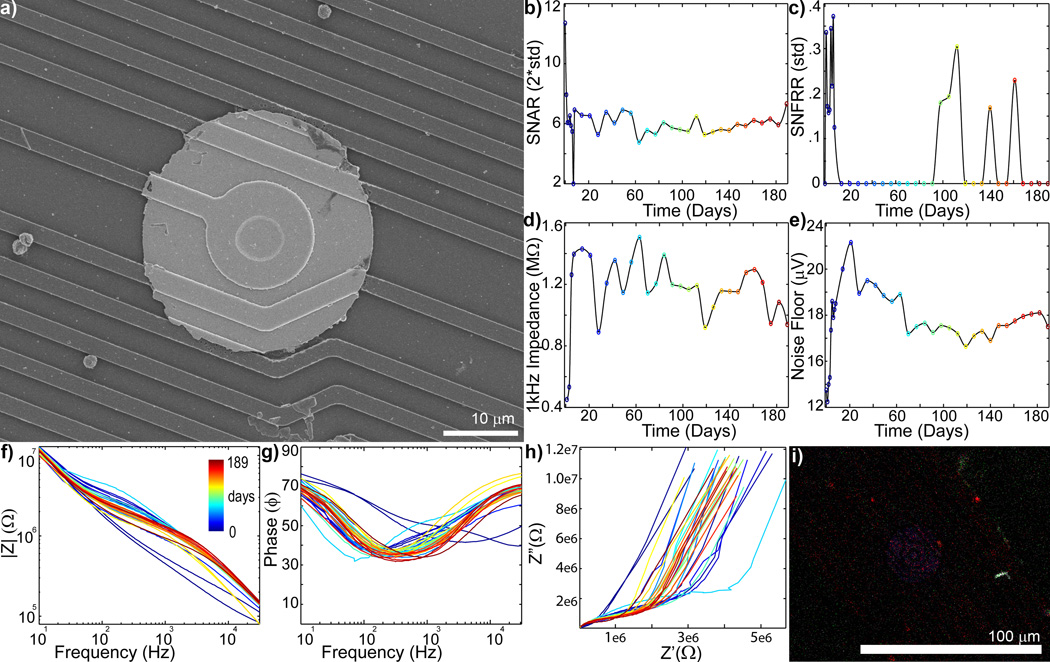
Figure 8.
Recording sites with good recording performance show limited material failure (day 0 = blue to day 189 = red: recording site #12 of Fig. S4). a) SEM of recording sites showing good material stability. Careful examination of the traces around the edge of the Ir electrode shows small perforations in the insulation. b) SU SNAR shows robust single-unit activity over the duration of the implant. c) MU SNFRR shows some evoked activit. d) 1kHz Impedance increases over the first week, but is largely stable. e) Noise floor also shows gradual increase over the first week, but is mostly stable thereafter. f) Bode Magnitude(|Z|) shows an increase over the first week, but is stable after that. g) Bode Phase (Phase) shows mostly a decrease over the first week, but does not substantially change afterward. h) Nyquist (Z’ vs Z”) plot shows some shift over time, but the tail slope remains mostly the same. i) Immunohistochemistry [Iba1 (Green), Vimentin (Red), IgG (Blue), Hoechst (White)] shows no glial adhesion and limited vimentin labeling

