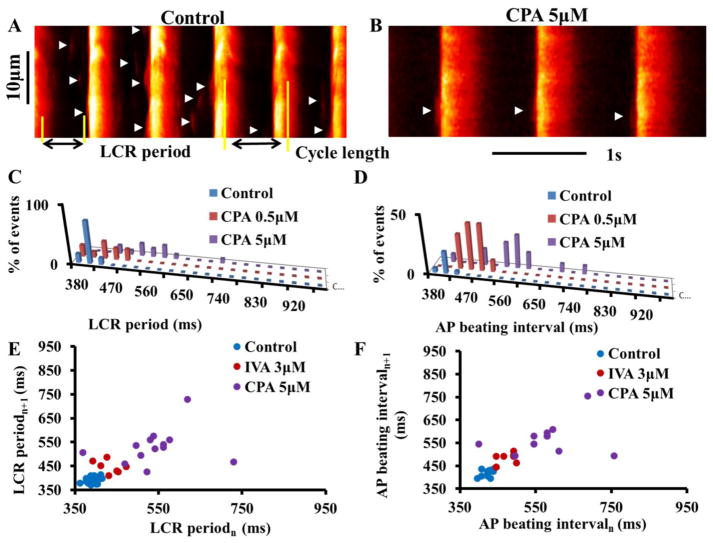
Figure 4. CPA directly affects the LCR period and LCR period variability.
Confocal line scan images of Ca2+ in a representative SANC (A) in control and (B) in response to 5μM CPA. LCRs are indicated by arrowheads. The LCR period is defined as the time from the peak of the prior AP-induced Ca2+ transient to an LCR onset. Distribution of (C) LCR period and (D) AP beating interval in control and in response to CPA in a representative cell. Poincaré plots of (E) the LCR period and (F) the AP beating interval in control and in response to CPA.

