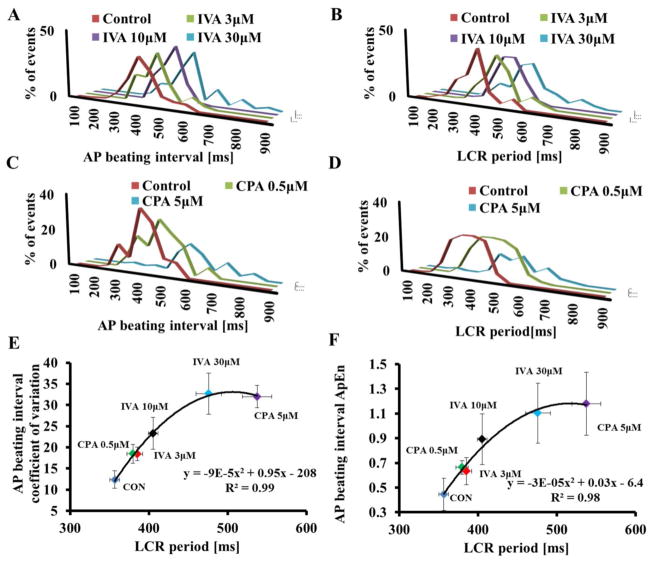
Figure 5. Effect of clock uncoupling by IVA or CPA on LCR period variability.
(A) AP-induced Ca2+ transient beating interval and (B) LCR period distributions (n=12 cells for each drug concentration, 121, 77 and 65 LCRs for 3, 10 and 30μM IVA, respectively). (C) AP-induced Ca2+ transient beating interval and (D) LCR period distribution in control (n=12 cells, 152 LCRs) and the presence of 0.5 μM CPA (n=12 cells, 114 LCRs), or 0.5 μM CPA (n=12 cells, 58 LCRs). The relationship between the average AP BIV, quantified by coefficient of variation (E) or as approximate entropy (F) to the LCR period prior to and in response to different concentrations of either IVA or CPA.

