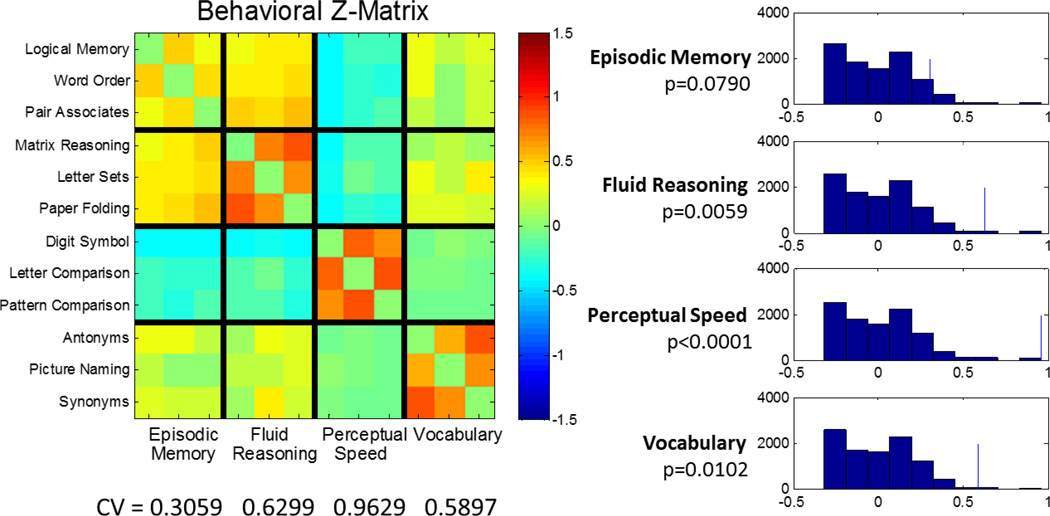
Figure 3.
Investigation of behavioral Construct Validity (CV). The matrix of inter-task performance correlations (=Z) is plotted on the left. Note that for the most part correlations are stronger between tasks within a reference ability than across tasks in different reference abilities. The observed CV statistics, the differences of mean Z- values within a reference domain to between -reference domains are displayed below the Z-matrix. Null-histograms for a permutation tests with 10,000 iterations are displayed on the right, with the point estimates marked by a thin blue line. All domains show significantly higher- within versus between-domain correlations, apart from the episodic memory domain. One can appreciate cross-talk from the Z-matrix; the permutation test bears this out with a marginal p-value of 0.0571.

