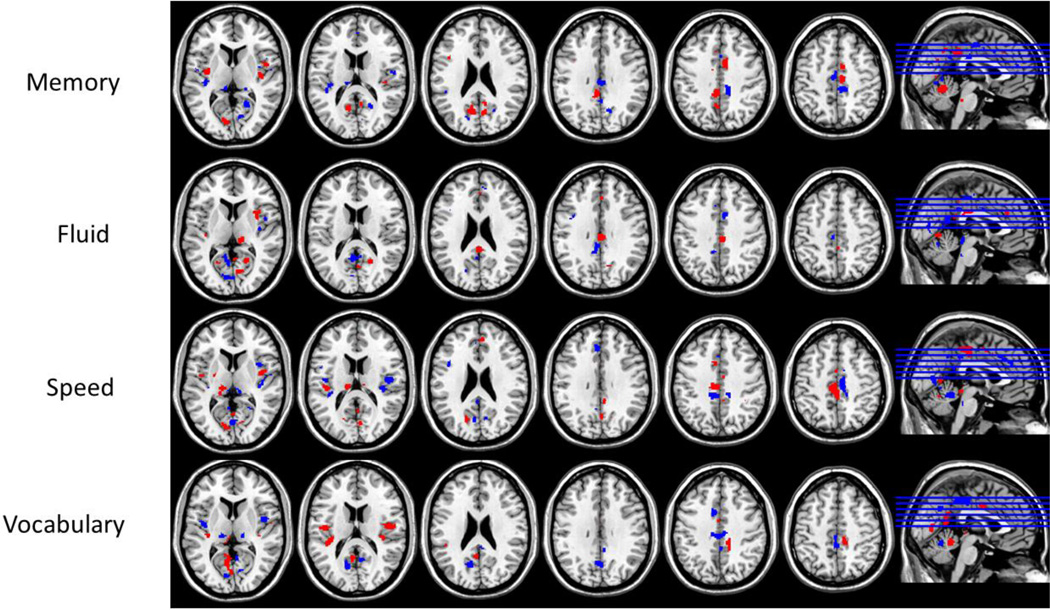
Figure 5.
Topographic activation patterns derived from the linear-indicator regression. Shown are the robustness Z-maps obtained from a bootstrap procedure with 500 iterations. Shown in blue are areas with loadings Z<−2, indicating negative task-activation, while areas with loadings Z>2, indicating positive task-activation, are shown in red.

