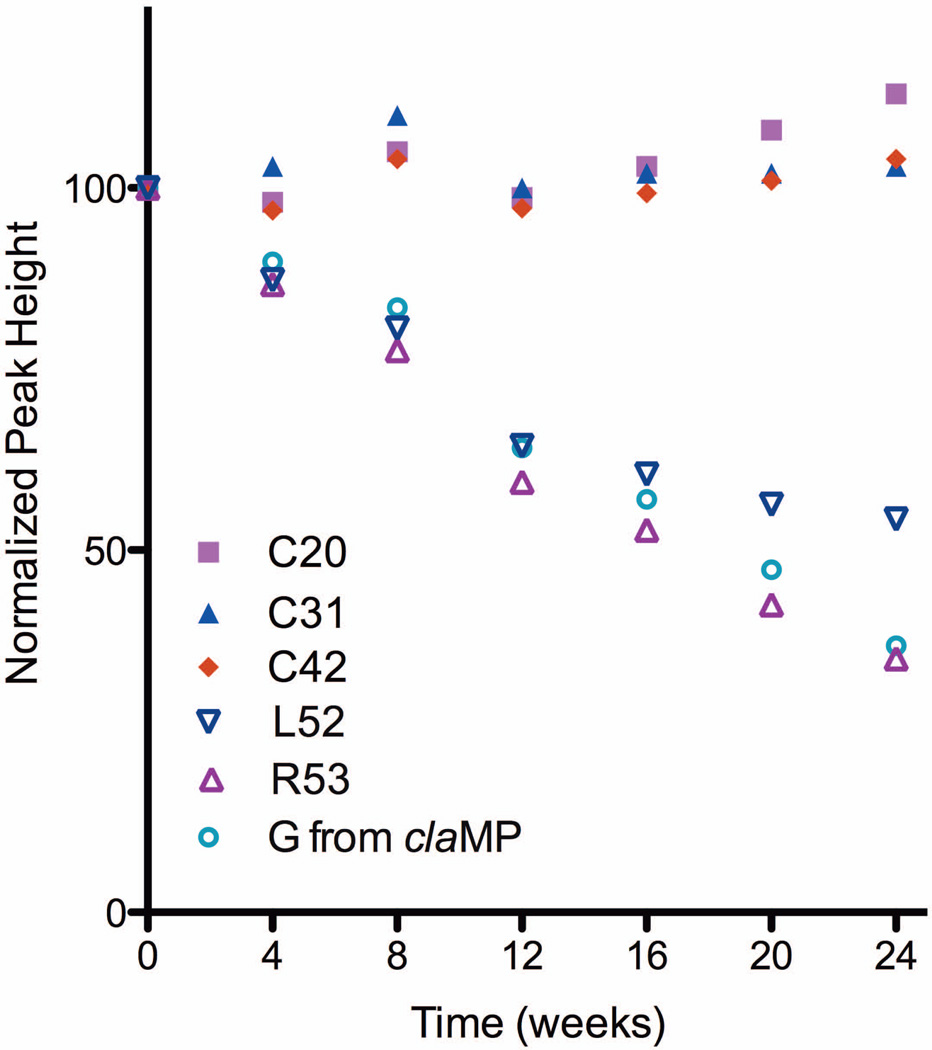
Figure 4.
Plot of NMR peak heights. The peak height corresponding to Cys residues confirms the protein structure is maintained and no loss of protein from solution occurs. The peak heights corresponding to the Gly from the claMP tag and C-terminal residues from EGF (L52, R53) decrease, indicating a change in structure in this region.

