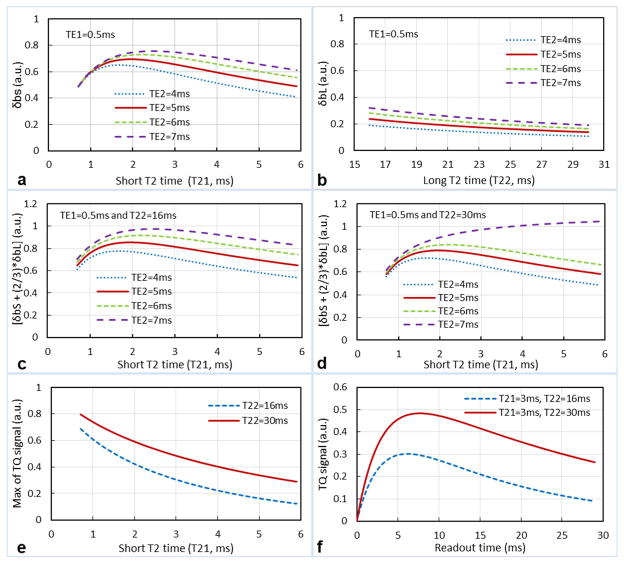
Fig. 2.
Simulated signal response of the short-T2 imaging: (a) single component of short T2 time, (b) single component of long T2 time, (c) two components of a long T2 time at low-end, and (d) two components of a long T2 time at high-end. (e) Signal response of TQF imaging. (f) Two of TQF signals used in e. A nearly-flat signal response is achieved in the short-T2 imaging at TE1=0.5ms and TE2=5–6ms (red lines in c, d), but not achieved in the TQF imaging (e).

