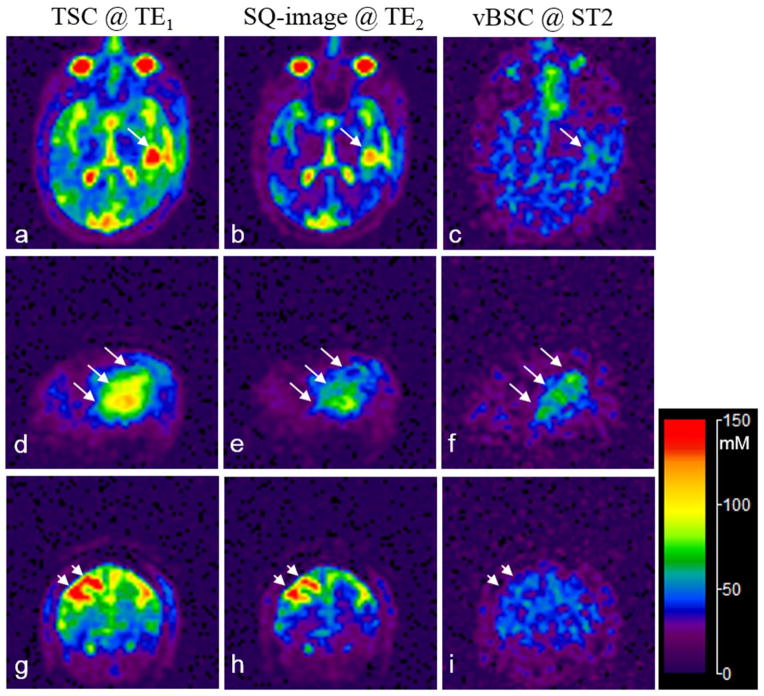
Fig. 9.
Sodium images of quantified total sodium concentration (TSC) and volume-fraction weighted bound sodium concentration (vBSC) for an adult brain tumor patient: (a–c) transverse, (d–f) sagittal, and (g–i) coronal views. The tumor region (long arrows, d–f) shows an increase not only in TSC (a, d) but also in vBSC (c, f). The CSF-filled cavity (short arrows, g–i) shows an increase in TSC (g) but not in vBSC (i). The calibrated SQ-images (b, e, h) at TE2 (=5.0ms) show visible decays in intensity of the short-T2 component compared with the corresponding images (a, d, g) at TE1 (=0.44ms). The tumor and cavity was confirmed in the proton (1H) images in Fig. 10.

