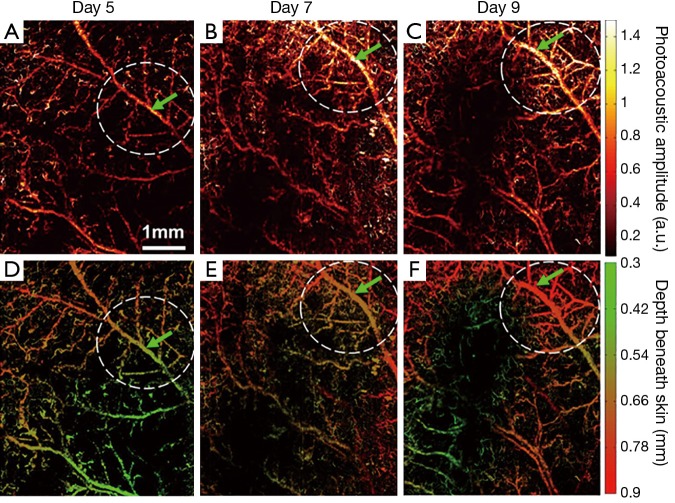
Figure 4.
Longitudinal OR-PAM of developing 4T1 tumor angiogenesis (case 1) on (A) day 5; (B) day 7; and (C) day 9 post implantation; (D-F) depth-encoded MAP corresponding to (A-C). The vessel indicated by the green arrow and the region marked by the white dashed circle are extracted for further quantitative analysis shown in Figure 5. OR-PAM, optical-resolution photoacoustic microscopy; MAP, maximum amplitude projection.

