Figure 5.

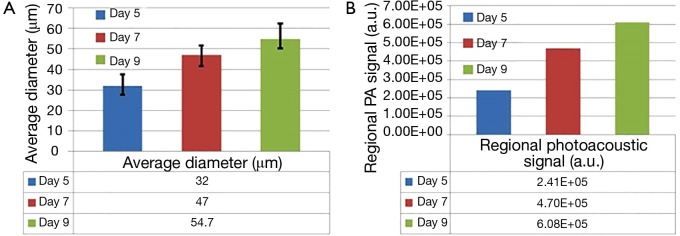
(A) Diameter change of the vessel indicated by the green arrow in Figure 4. The values are calculated by averaging over 10 evenly selected locations along the vessel. The error bar represents the standard deviation of the 10 measurements. (B) Change of the photoacoustic signals integrated over the area marked by the dashed white circle in Figure 4.
