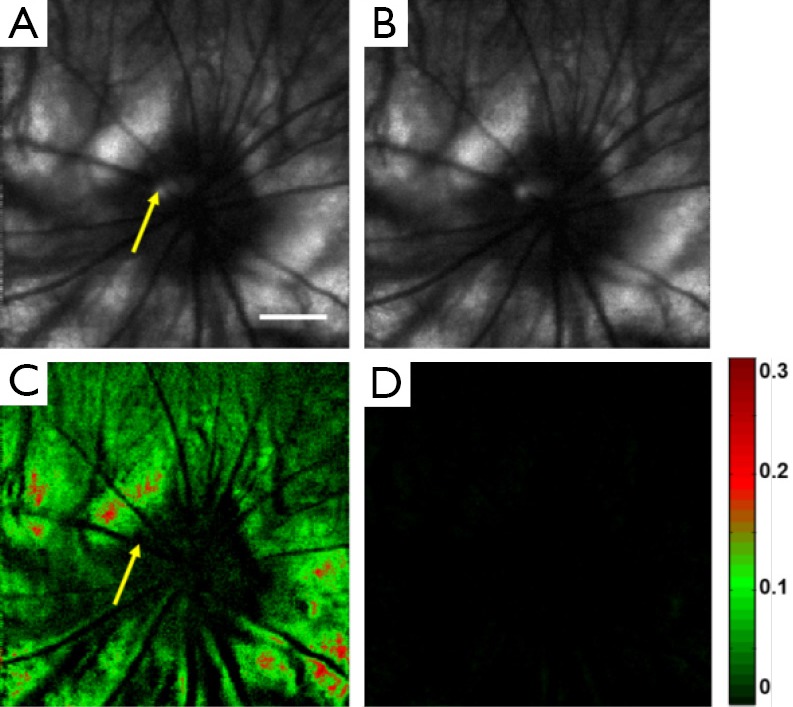
Figure 2.

Rhodopsin imaging of a rat retina with external bleaching light between acquisition of the dark- and light- adapted images. (A) Retinal image of the dark-adapted retina; (B) retinal image of the light-adapted retina; (C) normalized differential image calculated from (A) and (B) representing the distribution of rhodopsin in the retina; (D) normalized differential image calculated from the two sequentially acquired light adapted images. Bar: 10°. (C) and (D) share the same color map.
