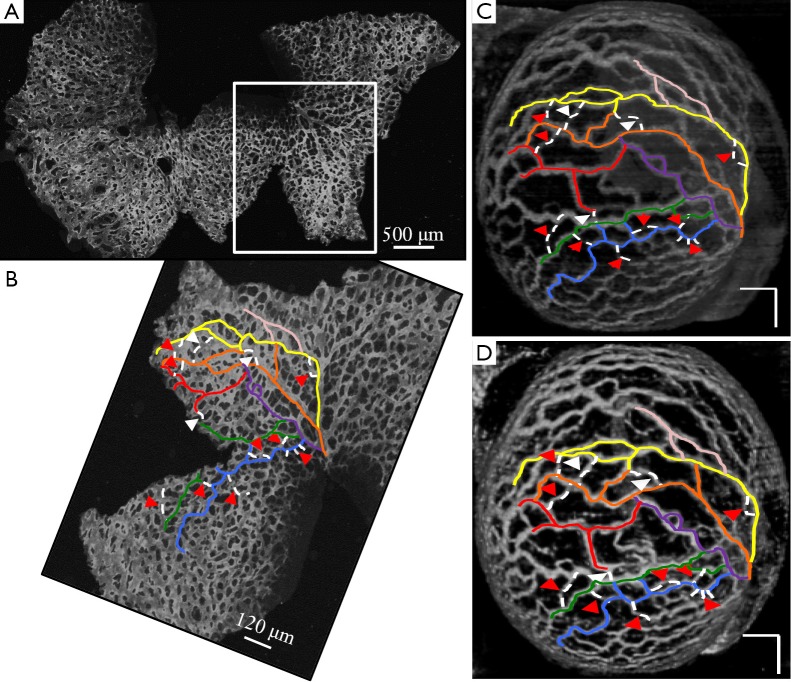
Figure 4.
Comparison of SSAD reconstruction result with corresponding confocal data. (A) Maximum intensity projection of the confocal image of E9.0 embryo (Figure 3). Highlighted region corresponds to the part of the yolk sac which is imaged using OCT; (B) Cropped section corresponding to the highlighted region in (A); (C) A 3-D rendering of the SV result; (D) A 3-D rendering of the SSAD reconstruction result. Scale bars in (C,D) correspond to 250 µm. Images were linearly normalized from 0-255. Corresponding vessel segments in (B-D) are highlighted with the same color. Red arrows in (C,D) point to the vessel segments which are detected by SSAD but are partially or completely missed by SV, while white arrows indicate the segments which are reconstructed with a comparative higher quality. Corresponding locations, as pointed in (B), confirm that these structures indeed correspond to vessel segments (dashed lines) which are present in the confocal data. Figure validates the ability of the proposed method to perform robust detection of blood vessels from OCT data. OCT, optical coherence tomography; SV, speckle variance; SSAD, sparsity-integrated speckle anomaly detection.

