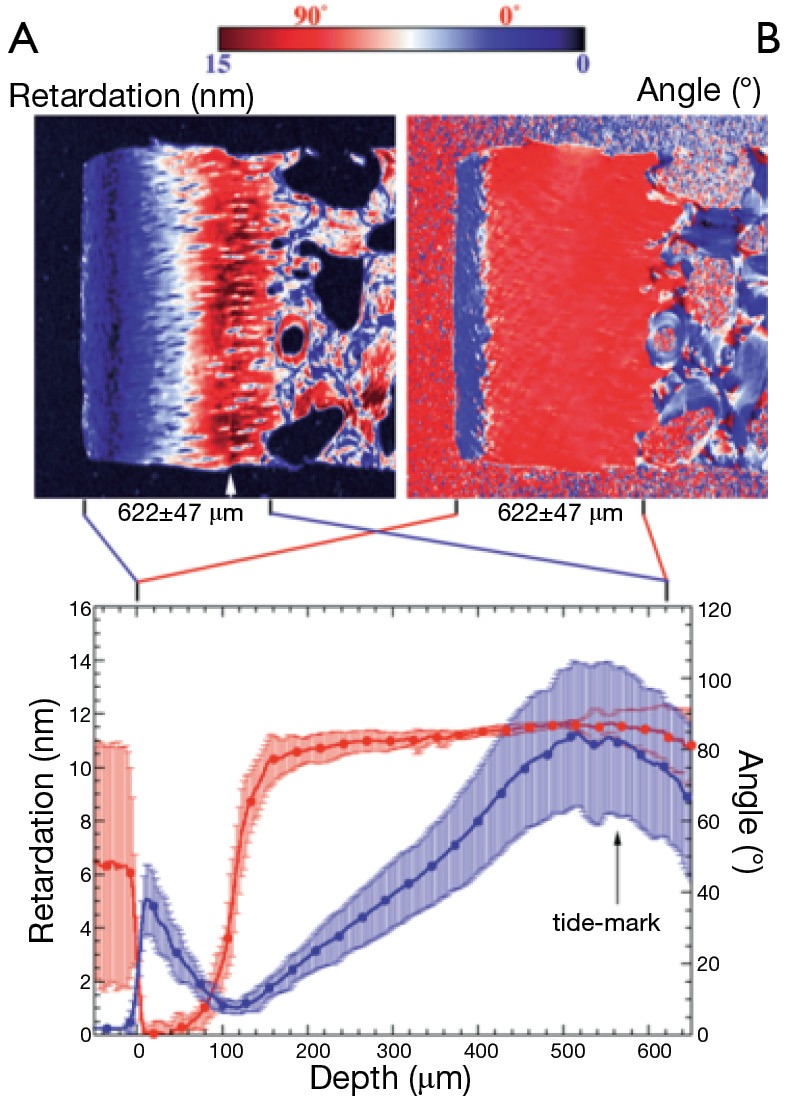
Figure 2.

Cartilage section analysed using the qPLM technique. The true retardance and fast-axis orientation are produced by this extended polarized light technique. Reproduced from Xia et al. (8) with permission. A clear minimum in the retardance at ~120 m depth is interpreted as the disorganized collagen of the “transitional zone”. qPLM, quantitative polarized light microscopy.
