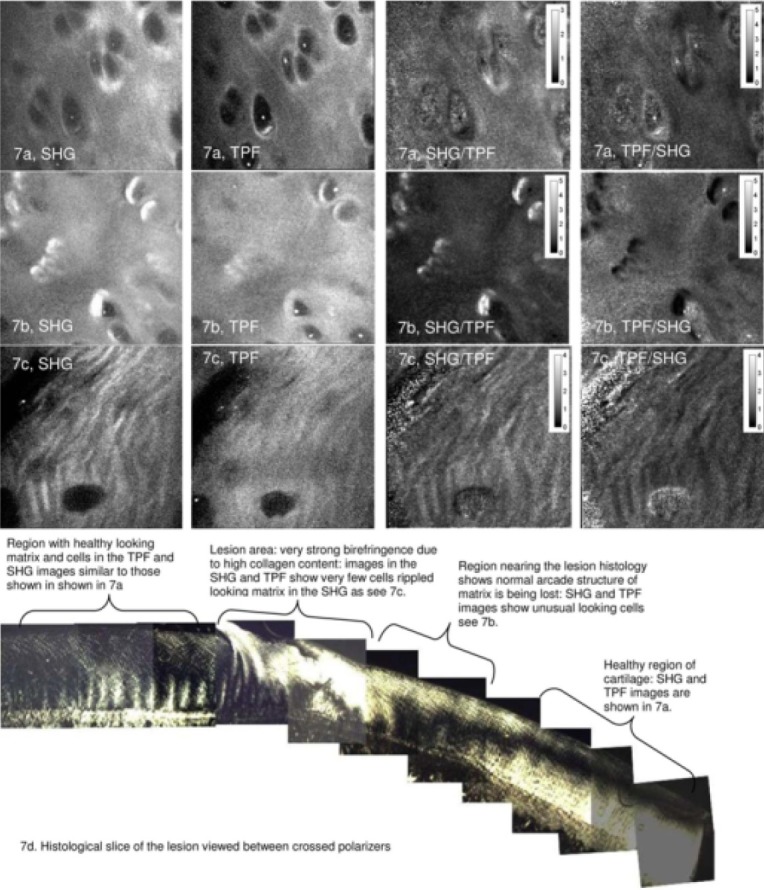
Figure 7.

SHG and TPF images taken from three sites on the surface of an equine metacarpophalangeal sample displaying a visible osteoarthritic lesion. (A) SHG (column 1) and TPEF (column 2) from a site appearing visibly normal and far from the lesion, with polarized light imaging (bottom) showing an intact Benninghoff architecture. (B) A visibly normal site near the lesion, where polarized light imaging implies some loss to the arcade structure. SHG images show cells with an abnormally bright pericellular rim. (C) The site of the lesion, with polarized light imaging showing highly birefringent fibrous repair tissue. SHG images appear fibrillated and TPEF image lack cell nuclei. Reproduced from Mansfield et al. (33) with permission. SHG, second harmonic generation.
