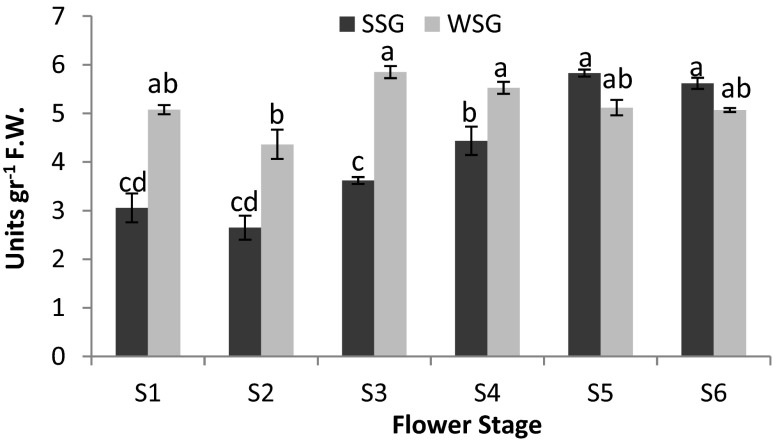
Fig. 4.
Comparison of phenyl acetaldehyde reductase (PAR) enzyme activity during flower developmental stages (S) from two distinct genotypes (SSG and WSG) of Rosa damascena. Error bars are standard deviation of the mean. The mean enzyme activity value was calculated with three replications. The different letters denote a statistically significant difference at P ≤ 0.05, as determined by Duncan’s new multiple range tests

