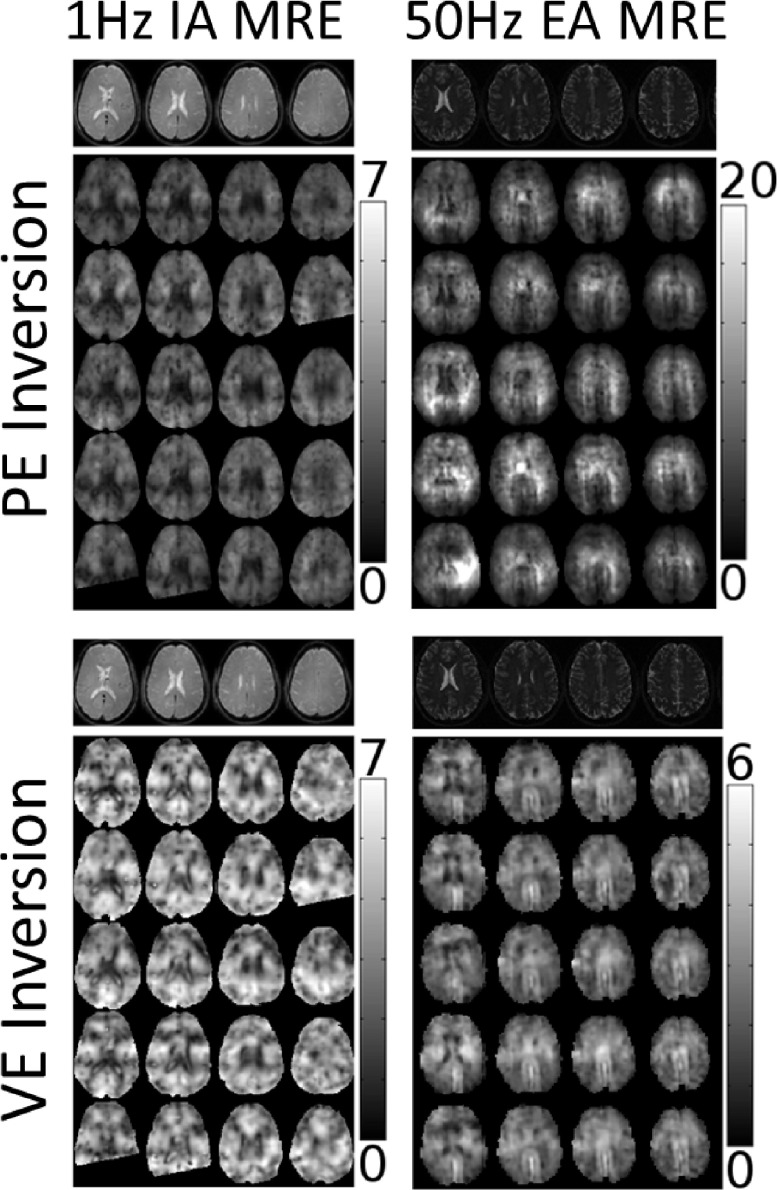
FIG. 2.
Repeated brain MRE shear modulus inversions using viscoelastic (μs) and poroelastic (μp) models. The left column corresponds to 1 Hz IA data and the right column results from 50 Hz EA data. Both PE (top row) and VE (bottom row) images are given for each data source. The columns within each image panel show four representative MRE slices whose positions are indicated by the anatomical images in the top row. The bottom five rows show the coregistered repeated MRE shear modulus images for each model.

