
Fig. 3.
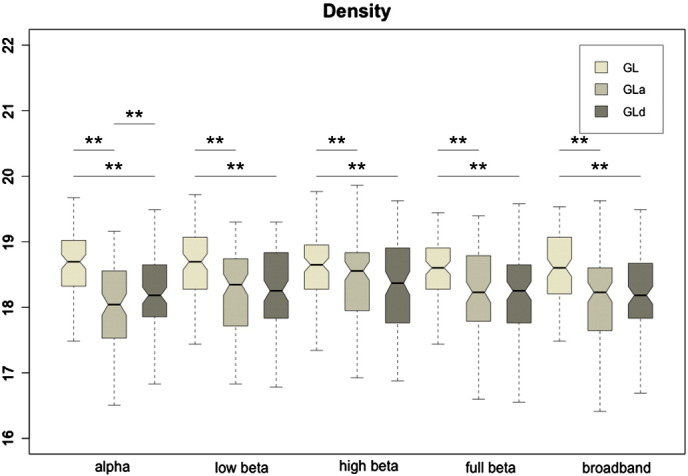
Boxplots of the density values for the three implemented graphical lasso approaches: GL, GLa and GLd. The double asterisk indicates that the distributions differ with significance p < 0.05 after paired t-test statistical comparison, and survived a False Discovery Rate multiple comparisons correction (qFDR < 0.05).