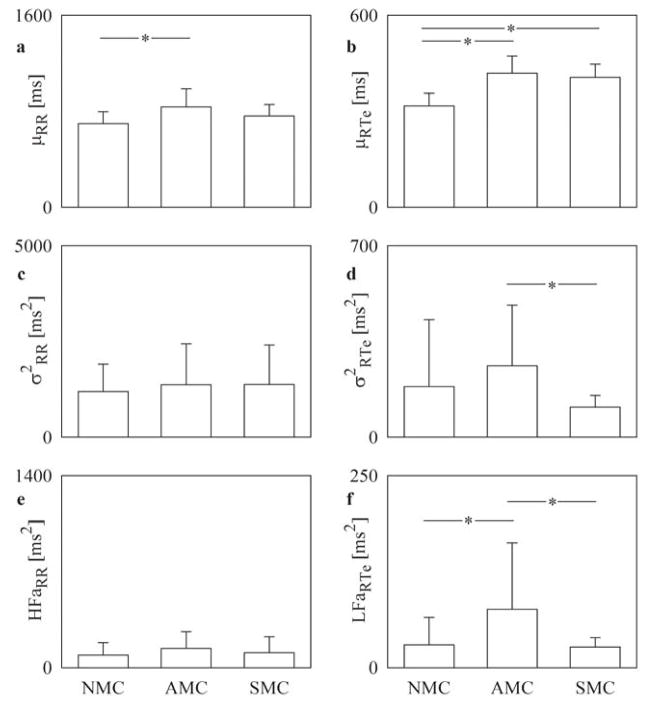
FIGURE 1. βBoff in NMCs, AMCs, and SMCs during DAY.
Bar graphs report the RR mean, μRR (A); RTe mean, μRTe (B); RR variance, σ2RR (C); RTe variance, σ2RTe (D); high-frequency (HF) power of the RR series expressed in absolute units, HFaRR (E); and low-frequency (LF) power of the RTe series expressed in absolute units, LFaRTe (F) assessed βBoff in NMCs, AMCs, and SMCs during DAY (from 2:00 PM to 6:00 PM). Values are mean + SD. *p < 0.05. AMC =asymptomatic mutation carrier; βBoff = off β-blocker therapy; NMC = nonmutation carrier; SMC = symptomatic mutation carrier.

