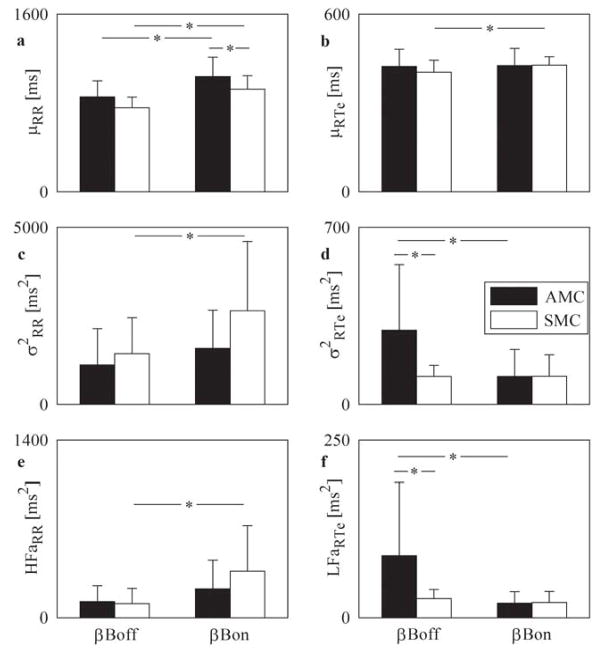
FIGURE 3. βBoff and βBon in AMCs and SMCs during DAY.
Grouped bar graphs report μRR (A), μRTe (B), σ2RR (C), σ2RTe (D), HFaRR (E), LFaRTe (F) assessed βBoff and βBon in AMCs (dark bars) and SMCs (white bars) during DAY. Values are mean + SD.*p < 0.05. βBon = on β-blocker; other abbreviations as in Figure 1.

