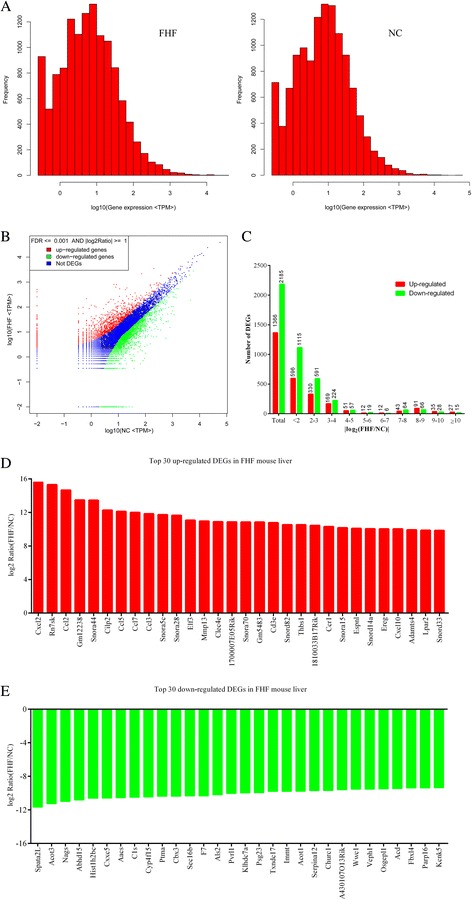
Figure 2.

The distribution of differentially expressed genes in FHF library. (A) Distribution of gene expression between FHF (left) and NC groups (right). (B) Comparison of gene expression between FHF and NC libraries. (C) Distribution of DEGs by fold changes. (D) The top 30 up-regulated DEGs in FHF mouse liver. (E) The top 30 down-regulated in FHF mouse liver.
