
Figure 1.
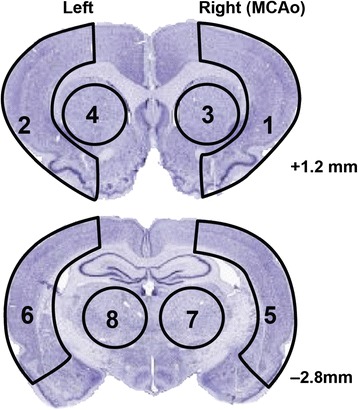
Diagram of brain sampling for EB study. Coronal sections of rat brain illustrating division of right (R) and left (L) hemispheres into eight regions for measurement of tissue Evans Blue dye. Coronal levels with references to bregma are noted.