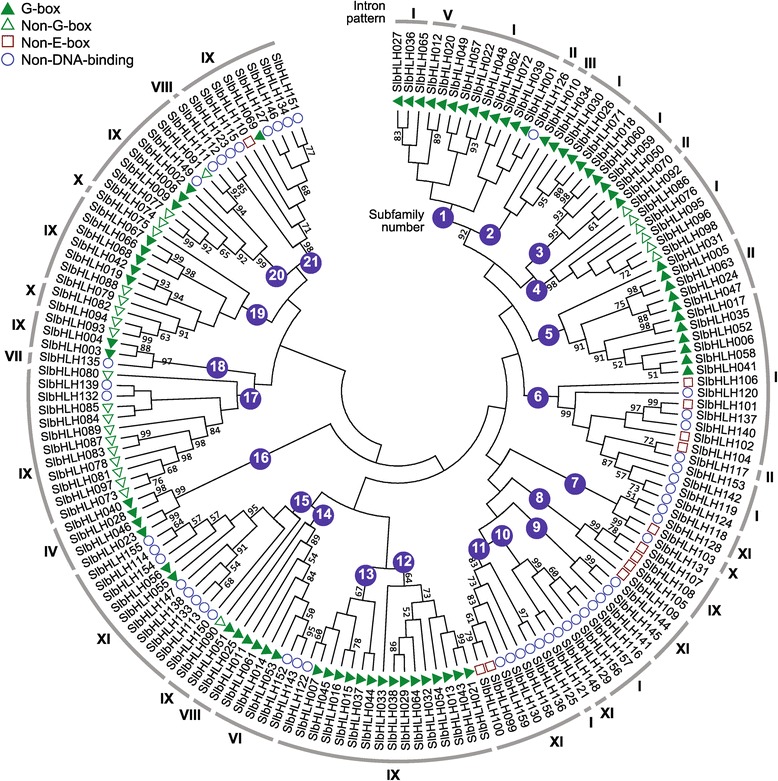
Figure 4.

Relationship of neighbor-joining phylogenetic tree of the SlbHLH domains with the predicted DNA-binding activities and the intron distribution patterns. The tree shows the 21 phylogenetic subfamilies marked with white font on a colored background. Roman numerals correspond to the intron patterns shown in Figure 3. The different shape on the left side of SlbHLH represents the predicted DNA-binding activity of each protein.
