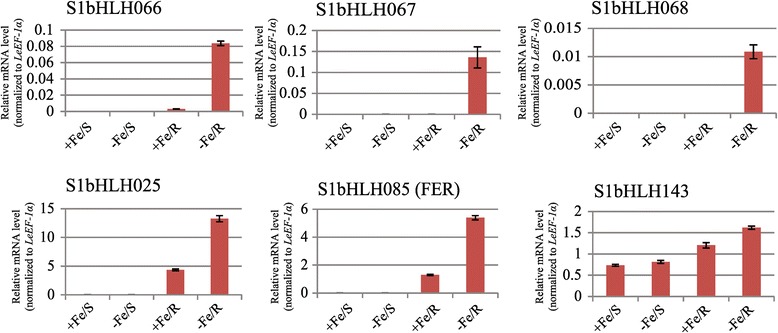
Figure 6.

Expression analyses of the six SlbHLH genes under iron-deficient stress by qRT-PCR. For qRT-PCR, the relative amount of mRNA (y-axis) was calculated by according to the description in Methods. The x-axis indicates the shoot (S) and root (R) of tomato under iron-sufficient (+Fe) and iron deficient (-Fe) conditions.
