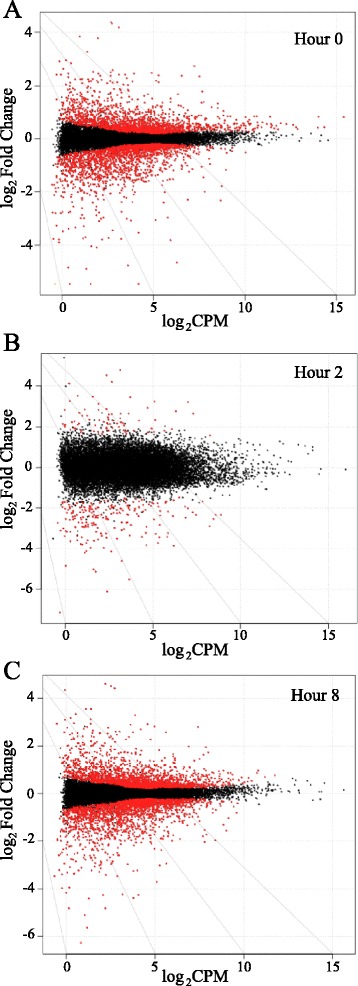
Figure 2.

Scatter plots of RNA-Seq analysis. Scatter plots of indexes analyzed from RNA-Seq for expression level (log2CPM) and differential expression (log2 Fold Change) at (A) 0 hours, (B) 2 hours, (C) and 8 hours post-LPS exposure. Positive fold change values indicate higher expression in young cultures while negative values show higher expression in old cultures. Red dots denote FDR < 0.05.
