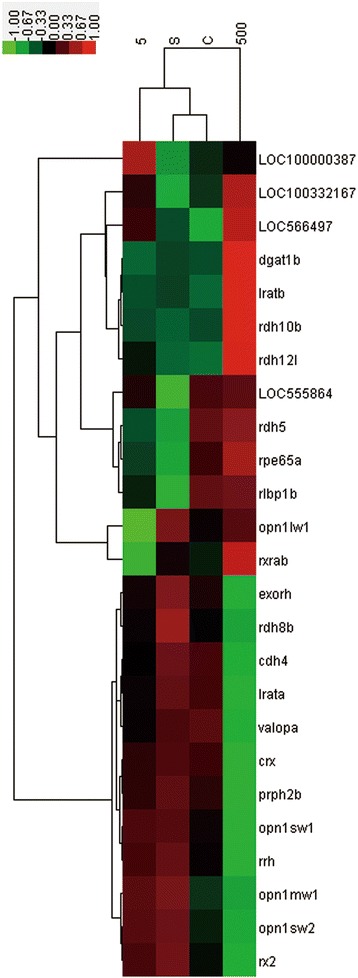
Figure 5.

Genes differentially transcribed related to vision formation and eye development in zebrafish larvae. Hierarchical-clustering-analysis-based transcription levels were performed on 25 related genes showing significant differential expression (p < 0.05) in larvae. Gene tree (left) and condition tree (top) were obtained using Pearson’s uncentered distance metric calculated from all log10 transcription ratios (exposed/controls). Color scale from green to red indicate log10 ratios from −1.00 (10-fold down-regulation) to +1.00 (10-fold up-regulation). C: control; S: vehicle (0.1% DMSO); 5: 5 μg/l BDE47 treatment; 500: 500 μg/l BDE47 treatment.
