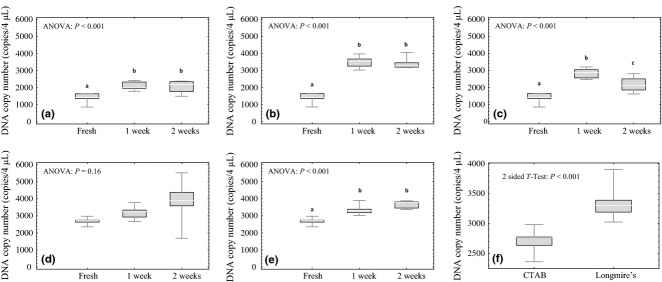
Fig 1.

Box and whisker plots for the filter preservation experiment. The top and bottom of the whiskers represent the maximum and minimum values, the top and bottom of the boxes represent the 75% and 25% quartiles, and the lines inside the boxes represent the median values. Significance in pairwise comparisons of treatments is noted by letters a, b and c where different letters represent statistically significant differences. Two preservation buffers, CTAB and Longmire's, were evaluated over a 2-week interval of time. (a) CTAB with −20 °C storage, (b) CTAB with 20 °C storage, (c) CTAB with 45 °C storage, (d) Longmire's with 20 °C storage, (e) Longmire's with 45 °C storage and (f) comparison between CTAB and Longmire's for fresh extractions.
