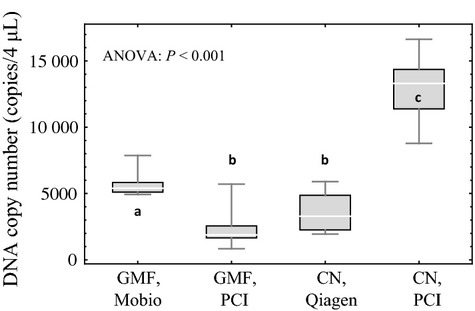
Fig 3.

Box and whisker plots for the PCI-kit comparison experiment. The top and bottom of the whiskers represent the maximum and minimum values, the top and bottom of the boxes represent the 75% and 25% quartiles, and the lines inside the boxes represent the median values. Significance in pairwise comparisons of treatments is noted by letters a, b and c where different letters represent statistically significant differences between experimental treatments. The four treatments were 1.5-μm glass microfibre filters (GMF) with MoBio extraction, 1.5-μm glass microfibre filters (GMF) with PCI extraction, 0.45-μm cellulose nitrate filters (CN) with Qiagen extraction and 0.45-μm cellulose nitrate filters (CN) with PCI extraction.
