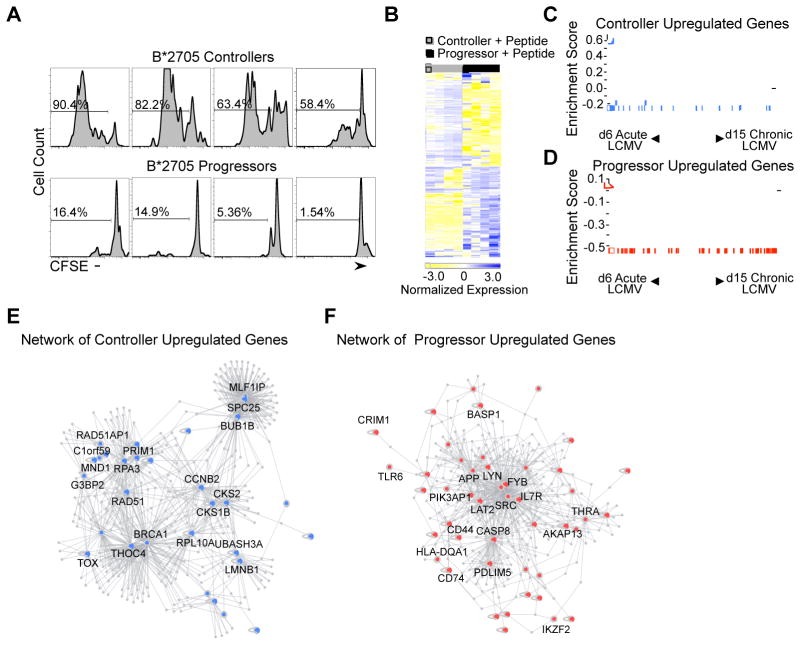
Figure 1. Transcriptional profiling analysis of peptide-stimulated HIV-specific CD8+ T cells from ECs and CPs.
(A) Histograms of gated viable CD8+ KK10-specific tetramer+ lymphocytes in B*2705 controllers and CPs stimulated with KK10 peptide (10 ng/mL). Numbers over bracketed lines indicate the percentages of the gated population (KK10 Tetramer+ CD8+ T cells) that have undergone at least one cell division after 6 days in culture. (B) The top differentially expressed genes in peptide-stimulated controller and CP KK10-specific CD8+ T cells are shown. Each column represents an individual sample and each row an individual gene, colored to indicate normalized expression (blue = increased expression, yellow = decreased expression). (C, D) Gene set enrichment analysis of upregulated gene sets in ECs and CPs with Day 6 LCMV Arm-specific CD8+ T cells (Acute LCMV) and Day 15 LCMV Cl13-specific CD8+ T cells (Chronic LCMV). The upregulated genes in HIV-specific CD8+ T cells from ECs were strongly enriched in the Acute LCMV Armstrong gene set (FDR q-value < 0.25). The upregulated genes in HIV-specific CD8+ T cells from CPs were strongly enriched in the Chronic LCMV Clone 13 gene set (FDR q-value < 0.25). The vertical blue and red bars indicate the individual genes that are enriched in both gene sets. (E, F) Direct and indirect DAPPLE networks built from upregulated gene expression sets from peptide-stimulated ECs (blue) and CPs (red) using known high-confidence pairwise protein-protein interactions (Rossin et al., 2011; Lage et al., 2008). See also Supplemental Table 2 and 3.

