
Figure 4. Effect of peptide stimulation on HIV-specific CD8+ T cell expansion and induction of cellular necrosis.
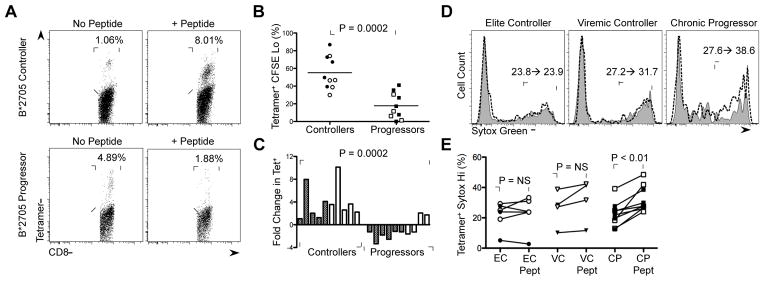
(A) Representative data of change in percentage of KK10-specific CD8+ T cells upon peptide stimulation in a HLA-B*2705 EC and CP. (B) Percentage of CFSE lo Tetramer+ CD8+ T cells in HLA-B*2705 KK10-specific (filled) and HLA-B*5701 KF11-specifc (open) CD8+ T cell responses in ECs and CPs. Statistical comparisons were made by the Mann-Whitney test. (C) Summary data of fold-change in Tetramer+ CD8+ T cells upon peptide stimulation in HLA-B*2705 KK10-specific (filled) and HLA-B*5701 KF11-specific (open) CD8+ T cell responses in ECs and CPs presented in (B). Statistical comparisons were made by the Mann-Whitney test. (D) Representative data of change in percentage of Sytox green Hi KK10-specific CD8+ T cells upon peptide stimulation in an HLA-B*2705 EC, viremic controller and CP. Filled plot (gray) represents Sytox green staining in the absence of KK10 peptide and dashed line represents Sytox green staining in the presence of KK10 peptide. (E) Summary data of change in percentage of Sytox green Hi HIV-specific CD8+ T cells following peptide stimulation in ECs (n = 6), VC (n = 4) and CPs (n = 8). Statistical comparisons were made using the Wilcoxon matched pairs test. See also Supplemental Figure 4.