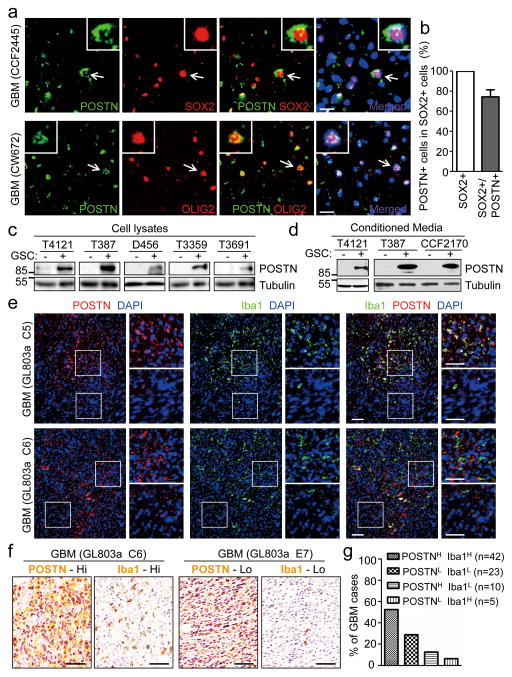
Figure 1. POSTN is preferentially secreted by GSCs and its levels correlate with TAM density in GBMs.
a, Immunofluorescent staining of POSTN (green) and the GSC marker OLIG2 or SOX2 (red) in human primary GBMs. Frozen sections of GBMs (CCF2445 and CW672) were immunostained with antibodies against POSTN and SOX2 or OLIG2, and counterstained with DAPI to show nuclei (blue). POSTN was preferentially expressed in GSCs and distributed in the area near GSCs. Scale bar, 20μm. b, Graphical analysis of (a) showing the fraction of POSTN+ cells in SOX2+ cells (GSCs) in human primary GBMs. More than 70% of SOX2 positive GSCs showed POSTN staining (n=5 GBMs; mean ± s.e.m.). c and d, Immunoblot analysis of POSTN expression in cell lysates (c) and conditioned media (CM) (d) from GSCs (+) and matched non-stem tumor cells (−). CMs were obtained by culturing equal numbers of GSCs and non-stem tumor cells in Neurobasal media without supplements for 24 hours and concentrating media by vacuum centrifugation. Endogenous tubulin amounts in the corresponding cells were used for control. e, Immunofluorescent analysis of POSTN (red) and the TAM marker Iba1 (green) in GBM tissue microarray (US Biomax). Two sets of representative staining were presented to show the enrichment of TAMs in POSTN abundant regions in GBMs. Areas indicated with squares were enlarged and shown on right side of each picture. Scale bar, 80μm. f, Immunohistochemical staining of POSTN and the TAM marker Iba1 in two consecutive tissue microarray slides, respectively. Representative staining images show that the GBM (GL803a-C6) with higher POSTN levels contained more Iba1+ cells (TAMs) and the GBM (GL803a-E7) with lower POSTN levels has less Iba1+ (TAMs). Scale bar, 40μm. g, Graphical analysis of POSTN and Iba1 staining in the tissue microarray slides. 52.5% of GBM cases showed POSTNHigh and Iba1High staining, and 28.75% of GBM cases showed POSTNLow and Iba1Low staining. Only 12.5% of GBM cases showed POSTNHigh but Iba1Low staining, and 6.25% of GBM cases showed POSTNLow but Iba1High staining. The majority (81.25%) of GBM cases showed that POSTN levels positively correlate with TAM density. (Data from 80 tumors).

