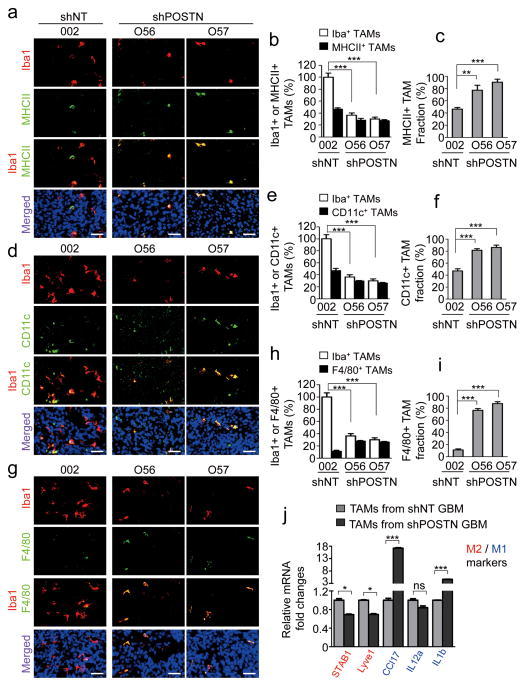
Figure 5. Silencing POSTN in GSCs increased relative fraction of M1 subtype TAMs in GSC-derived xenografts.
a, Immunofluorescent staining of the M1 TAM marker MHCII (green) and the pan macrophage marker Iba1 (red) in GSC-derived tumors expressing shPOSTN or shNT (control). Nuclei were counterstained with DAPI (blue). Scale bar, 40μm. b and c, Graphical analyses of (a) showing the reduced TAM density (b) but the increased MHCII+ M1 fraction (c) in shPOSTN-expressing tumors relative to shNT expressing tumors. Relative TAM density was normalized to total TAMs in shNT expressing xenografts. The M1 TAM fraction was determined by the percentage of M1 TAMs within TAMs in shNT or shPOSTN xenografts, respectively. ***, p<0.001; **, p<0.01 (n=5 tumors; mean ± s.e.m.; two tailed unpaired t-test). d, Immunofluorescent staining of the M1 TAM marker CD11c (green) and the pan macrophage marker Iba1 (red) in GSC-derived tumors expressing shPOSTN or shNT. Scale bar, 40μm. e and f, Graphical analyses of (d) showing the reduced TAM density (e) but the increased CD11c+ M1 fraction (f) in shPOSTN-expressing tumors relative to shNT expressing tumors. ***, p<0.001 (n=5 tumors; mean ± s.e.m.; two tailed unpaired t-test). g, Immunofluorescent staining of the mature TAM marker F4/80 (green) and the pan macrophage marker Iba1 (red) in GSC-derived tumors expressing shPOSTN or shNT. Scale bar, 40μm. h and i, Graphical analyses of (g) showing the reduced TAM density (h) but the increased F4/80+ mature TAM fraction (i) in shPOSTN-expressing tumors relative to shNT expressing tumors. ***, p<0.001 (n=5 tumors; mean ± s.e.m.; two tailed unpaired t-test). j, qPCR analysis of multiple M1 and M2 macrophage markers in CD11b+ populations from shNT-expressing or shPOSTN-expressing xenografts. M2 macrophage markers STAB1 and Lyve1 were significantly down-regulated in CD11b+ population isolated from shPOSTN-expressing xenografts, whereas M1 marker CCL17 and IL1b were markedly up-regulated. ***, p<0.001; *, p<0.05; ns, p>0.05 (mean ± s.e.m.; n = 3 biologically independent samples per group, one representative experiment shown, and the experiment was repeated 3 times).

