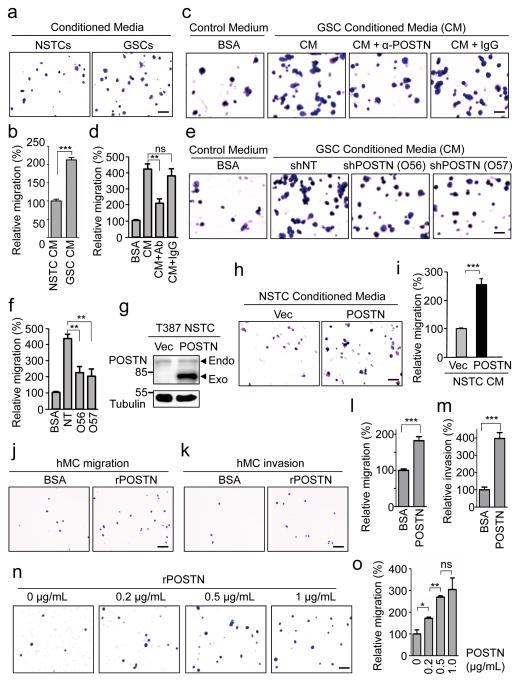
Figure 6. GSC-secreted POSTN is a chemoattractant to macrophages and monocytes.
a, Representative images of migrated macrophage-like U937 cells toward conditioned media (CM) from matched T387 GSCs and non-stem tumor cells (NSTCs) in transwell assays. Scale bar, 80μm. b, Graphical analysis of (a) showing a significant increase of U937 cell migration toward GSC CM relative to NSTC CM. ***, p<0.001 (n=5 fields; mean ± s.e.m.; two-tailed unpaired t-test). c, Representative images of migrated U937 cells toward GSC CM pre-incubated with or without anti-POSTN (10μg/mL) antibody or IgG. Scale bar, 40μm. d, Graphical analysis of (c) showed that the increased macrophage migration toward GSC CM was attenuated by anti-POSTN antibody. **, p<0.01; ns, p>0.05. (n=5 fields; mean ± s.e.m.; two-tailed unpaired t-test). e, Representative images of migrated U937 cells toward CM from GSCs expressing shPOSTN (O56 and O57) or shNT. Scale bar, 40μm. f, Graphical analysis of (e) showing a significant reduction of migrated U937 cells toward CM from GSCs expressing shPOSTN. **, p<0.01 (n=5 fields; mean ± s.e.m.; two-tailed unpaired t-test). g, Immunoblot analysis of POSTN in NSTCs transduced with POSTN or vector control. h, Representative images of migrated U937 cells toward CM from POSTN-overexpressing or control NSTCs. Scale bar, 80μm. i, Graphical analysis of (h) showing a significant increase of U937 cell migration toward CM from POSTN-overexpressing NSTCs. ***, p<0.001 (n=5 fields; mean ± s.e.m.; two-tailed unpaired t-test). j and k, Representative images of cell migration (j) and invasion (k) of human primary monocytes toward recombinant POSTN (rPOSTN) in transwell assays. Scale bar, 80μm. l and m, Graphical analyses of (j) and (k) showing rPOSTN significantly promotes migration and invasion of human monocytes/macrophages. ***, p<0.001 (n=5 fields; mean ± s.e.m.; two-tailed unpaired t-test). n, Representative images of migrated U937 cells toward different concentration of rPOSTN in transwell assays. Scale bar, 80μm. o, Graphical analysis of (n) showing that the migration of U937 macrophages toward rPOSTN protein was dose-dependent. *, p<0.05; **, p<0.01; ***, p<0.001; ns, p>0.05. (n=5 fields; mean ± s.e.m.; two-tailed unpaired t-test). All transwell assays were repeated three times.

