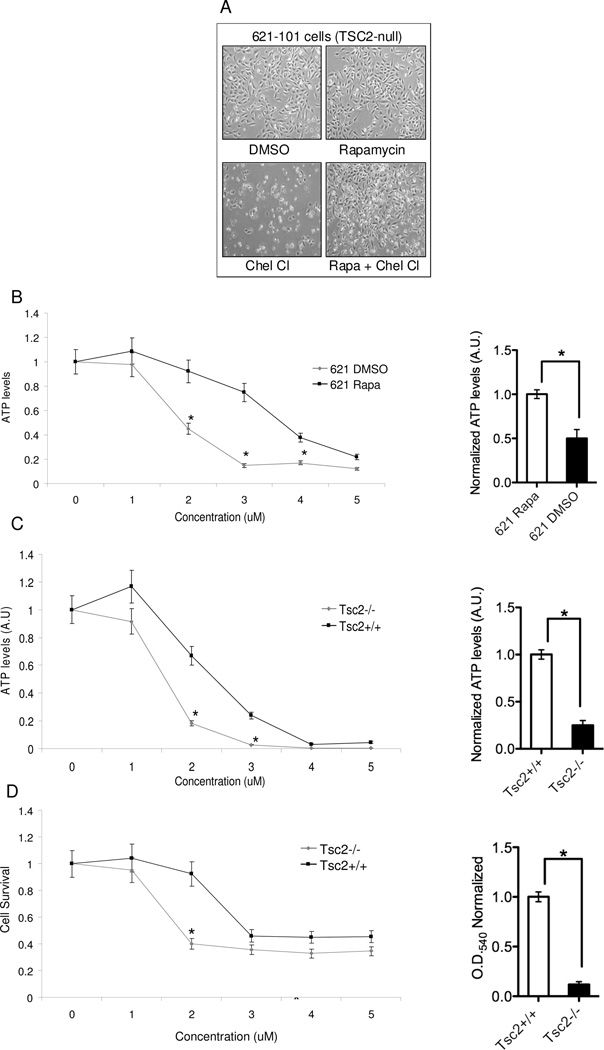
Figure 2. Chelerythrine chloride’s inhibition of TSC2-null cells requires mTORC1 activation.
A) Phase contrast images (4X) of 621-101 cells treated with for 24 hours with DMSO, Rapamycin (20 uM) chelerythrine chloride (2 uM), or 2 hour Rapamycin pretreatment followed by chelerythrine chloride. B, C) ATP levels (measured using CellTiter Glo) in 621-101 cells and Tsc2+/+ and Tsc2−/− MEFs treated with 5 doses of chelerythrine chloride (n=8 per dose, *p<0.05). Bar graphs show normalized ATP levels at 2 uM. D) Proliferation (measured by crystal violet staining) of Tsc2+/+ and Tsc2−/− MEFs treated with 5 doses of chelerythrine chloride (n=8 per dose, *p<0.05). Bar graph shows normalized OD at 2 uM.

