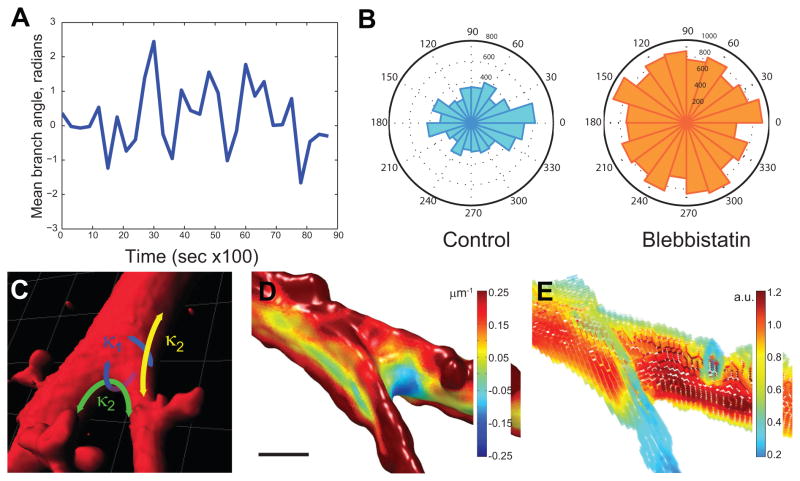
Figure 7. Myosin-II biases branch orientation in the direction of migration and shows differential association with inner high curvature and outer low curvature saddles at a branch base.
(A) Quantification of branch angle over time. An example cell was imaged every 300 seconds over time, and for each time point, a morphological skeleton was extracted as described in the Supplemental Methods. All branch vectors for a given time point were summed to derive a mean branch angle relative to the migration direction over all time points. (B) Radial histograms of branch angle relative to the direction of cell migration in the presence or absence of 20 μM blebbistatin; total branches indicated as radii shown for each condition over, n= 13 cells, 286 time points for control, n=11 cells, 129 time points for blebbistatin. (C) A typical branch geometry shown in a surface rendering of a branch region in AECs, with two sets of principle curvatures, one parallel to a plane containing the branch angle (κ2, green and yellow) and one perpendicular (κ1, blue). While the out-of-plane curvatures of the two saddles are comparable to each other and are dominated by the radii of the branches, the in-plane curvatures differ significantly with the saddle at the inner surface forming a higher negative curvature than the saddle at the outer surface. (D) Example of acute branch junction, where long region of low maximal curvature occurs at the outside of branch in the plane of the branch angle; a much smaller region of low maximal curvature occurs inside the branch junction. Color scale indicates local maximal curvature. (E) Heat map of GFP-myosin-IIA at cortex in the same branch junction. Color scale map indicates arbitrary units of GFP-myosin-IIA.

