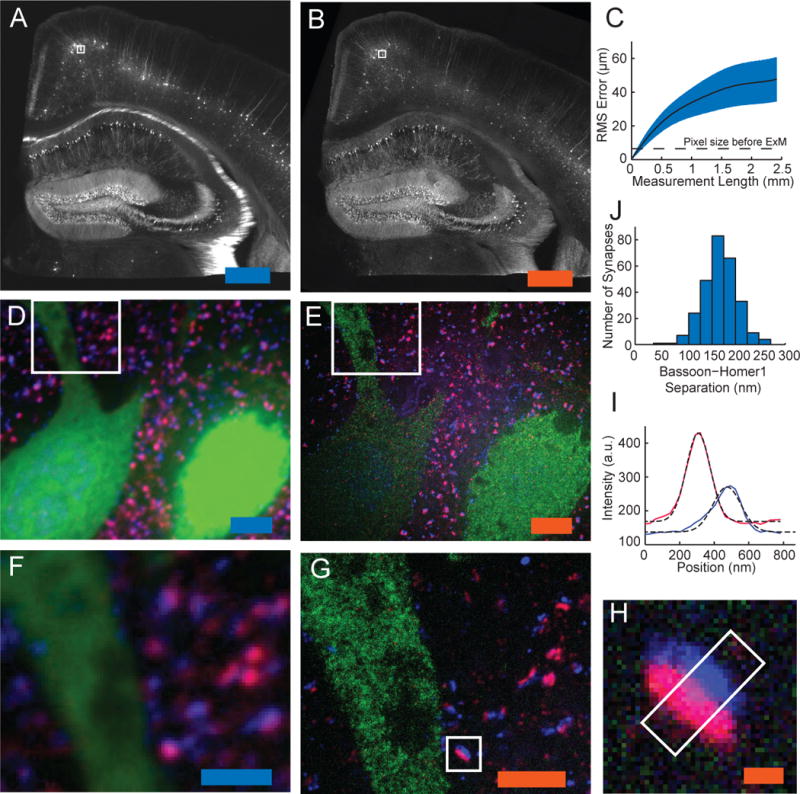
Figure 3. ExM imaging of mammalian brain tissue.

(A) Widefield image of Thy1-YFP mouse brain slice showing fluorescence (white). (B) Post-expansion widefield image of sample (A). (C) Root-mean-square (RMS) length measurement error for pre- vs. post-ExM images of brain slices (blue line, mean; shaded area, standard deviation; n = 4 samples). (D), (E) Confocal fluorescence images of boxed regions in (A) and (B) respectively, stained with pre-synaptic (anti-Bassoon, blue) and post-synaptic (anti-Homer1, red) markers, in addition to anti-GFP (green), pre- (D) vs. post- (E) expansion. (F), (G) Details of boxed regions in (D) and (E). (H) Single representative synapse highlighted in (G). (I) Staining intensity for Bassoon (blue) and Homer1 (red) of the sample of (H) along white box long axis. Dotted black lines, Gaussian fits. a.u., arbitrary units. (J) Bassoon-Homer1 separation (n = 277 synapses from 4 cortical slices). Scale bars for pre vs. post-ExM images: (A) 500 μm, (B) 500 μm (physical size post-expansion 2.01 mm); (D) 5 μm, (E) 5 μm (20.1 μm); (F) 2.5 μm, (G) 2.5 μm (10.0 μm) and (H) 250 nm (1.00 μm).
