
Figure 4. Scalable 3D super-resolution microscopy of mouse brain tissue.
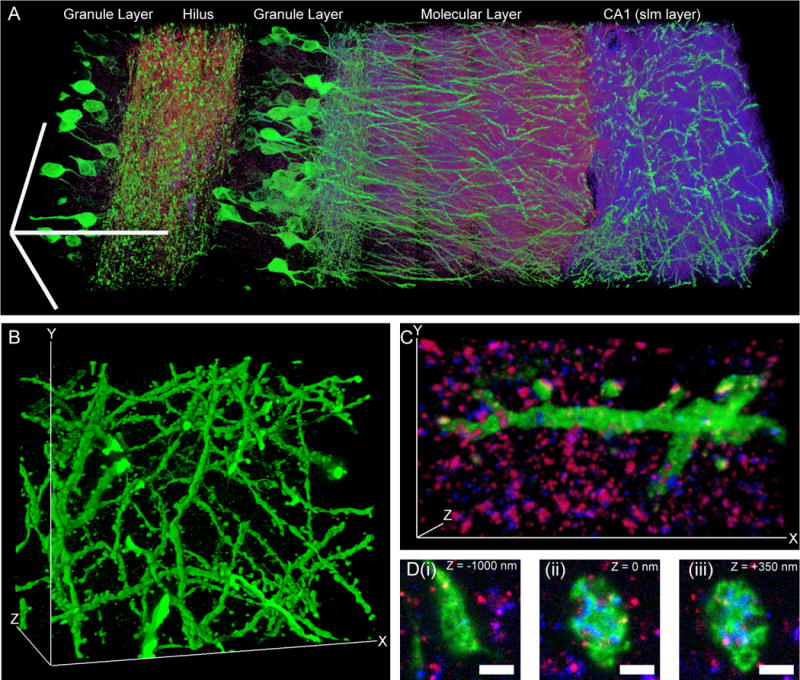
(A) Volume rendering of a portion of hippocampus showing neurons (expressing Thy1-YFP, shown in green) and synapses (marked with anti-Bassoon (blue) and anti-Homer1 (red)). (B) Volume rendering of dendrites in CA1 stratum lacunosum moleculare (slm). (C) Volume rendering of dendritic branch in CA1 slm. (D) Mossy fiber bouton in hilus of the dentate gyrus. Panels (i–iii), selected z-slices. Scale bars: (A) 100 μm in each dimension; (B) 52.7 μm (x), 42.5 μm (y), and 35.2 μm (z); (C) 13.5 μm (x), 7.3 μm (y), and 2.8 μm (z); (D) (i–iii) 1 μm.