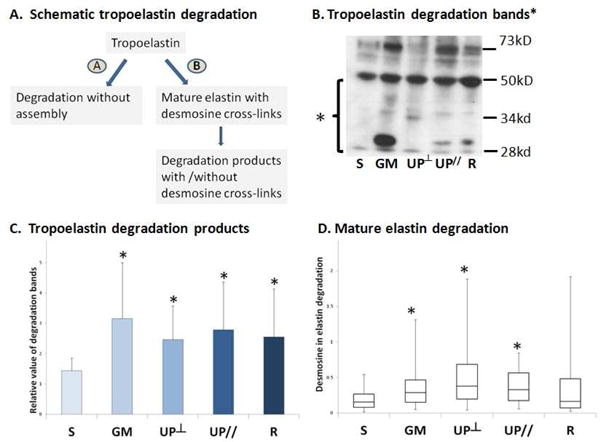
Figure 4.

Elastin degradation in the vagina after mesh implantation. A. Flow chart elucidates the degradation pathways of elastin; B. Representative western blot image for tropoelastin degradation; C. Bar graph showing the mean and standard deviation of tropoelastin degradation by semi-quantification; D. Box and whisker graph showing the median, first and third quartiles of mature elastin degradation assayed by desmosine crosslink radioimmunoassay. S = Sham; GM = Gynemesh PS; UP┴ = UltraPro Perpendicular; UP// = UltraPro Parallel; R = Restorelle. * indicates significant difference from Sham (P<0.05).
