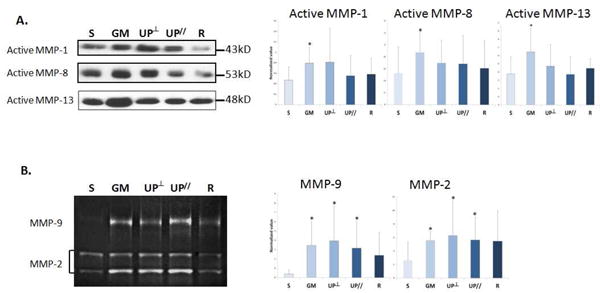
Figure 5.

Levels of A. Interstitial collagenase MMPs -1, -8, and -13; B. Elastase MMP-2 and -9 in the vagina after mesh implantation demonstrated by representative images from Western Blots and zymography, and bar graphs showing compiled mean (normalized to the values of internal control and loading control) and standard deviation. S = Sham; GM = Gynemesh PS; UP┴ = UltraPro Perpendicular; UP// = UltraPro Parallel; R = Restorelle. * indicates significant difference from Sham (P<0.05).
