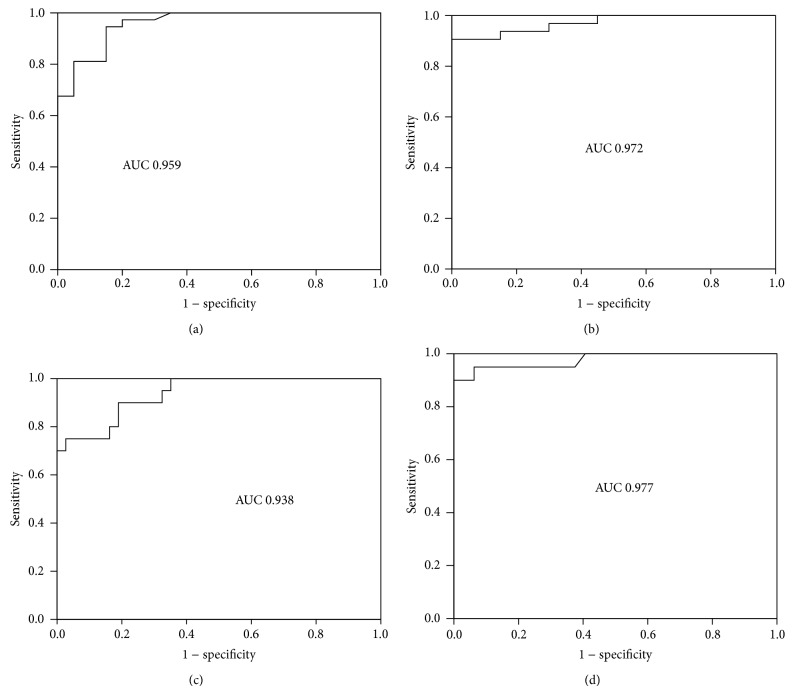
Figure 2.
Diagnostic value of circulating miR-765 and miR-149 was analyzed by ROC curve. (a) ROC curve of miR-765 between control group and stable group. The area under curve (AUC) is 0.959. (b) ROC curve of miR-765 between control group and unstable group. AUC is 0.972. (c) ROC curve of miR-149 between control group and stable group. AUC is 0.938. (d) ROC curve of miR-149 between control group and unstable group. AUC is 0.977.

