
Figure 1.
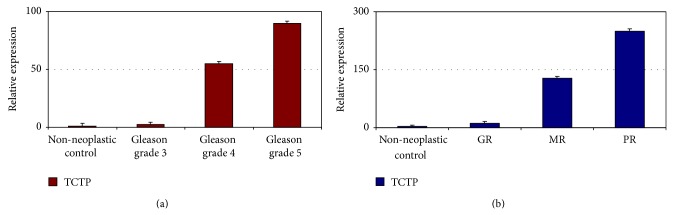
Relative expression of TCTP by RT-qPCR in tumors of different pattern in respect to normal control. In untreated patients, higher expression is observed in cancer, in respect to non-neoplastic control, with an increase as tumor grade progresses (a) (t-test, P < 0.05). In treated patients, we found that the more the treatment is effective, the less the expression level of TCTP is, which is almost comparable to non-neoplastic control in GR (b) (GR: good responders; MR: moderate responders; PR: poor responders) (t-test, P < 0.05). The graphs are representative of three different experiments. Error bars indicate standard deviation.