
Figure 5.
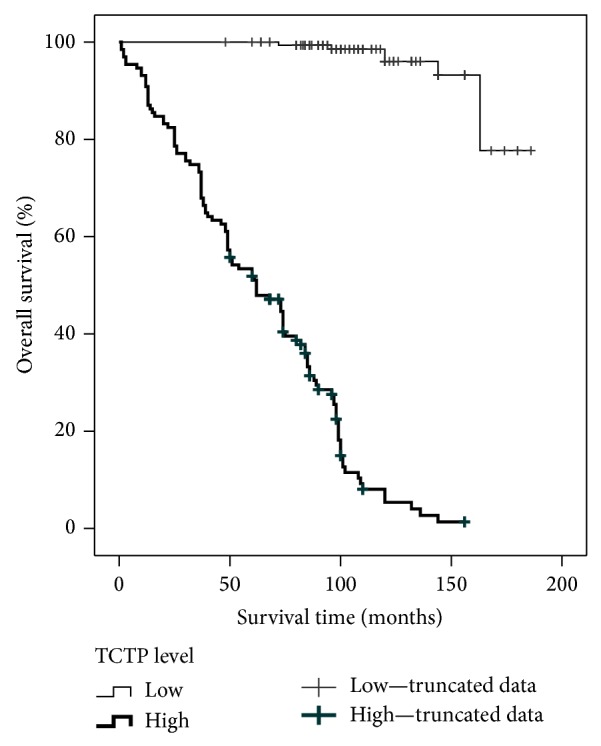
Kaplan-Meier curves of TCTP protein expression levels. Disease free survival was significantly different between the groups with high and low TCTP protein expression (log rank test, P < 0.001). The group with the higher TCTP protein expression has a shorter disease free survival (mean = 64 months) when compared to the group with the lower TCTP protein expression (mean = 178 months).