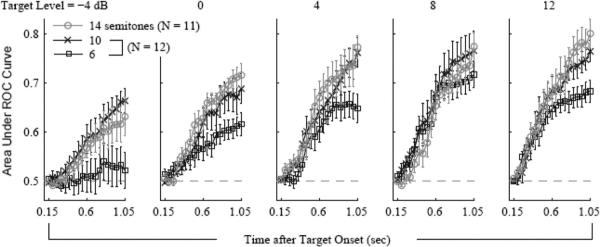
Figure 5.

Area under the receiver operating characteristic (ROC) curve as a function of time after target onset in Experiment 2. The different panels correspond to different target levels (relative to the masker), from low (left) to high (right). The error bars are standard errors of the mean across daily sessions.
