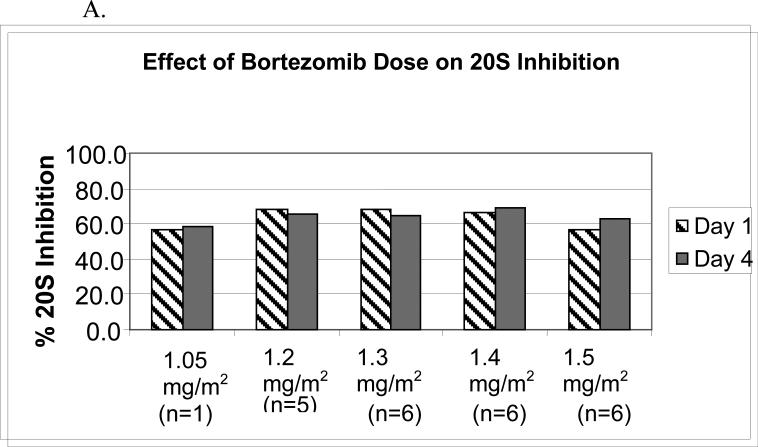
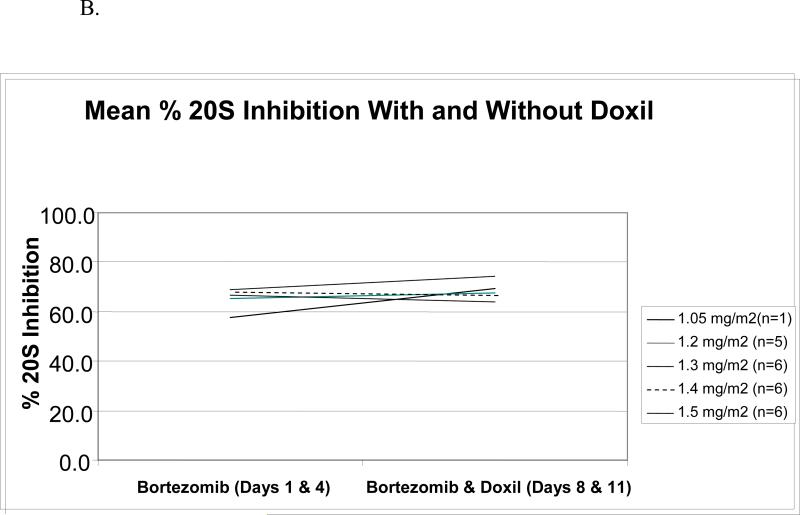
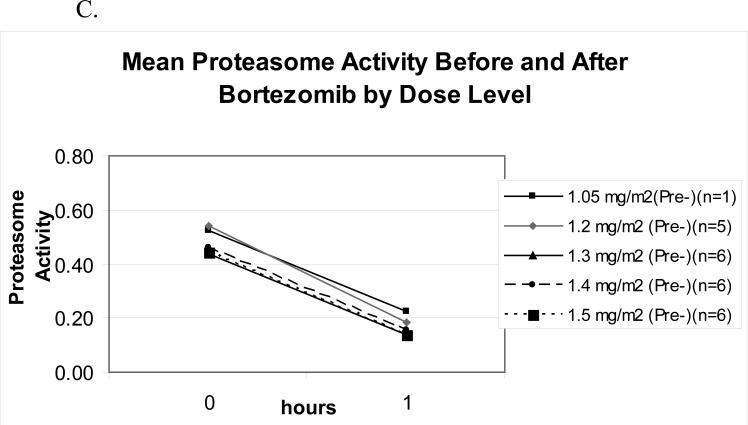
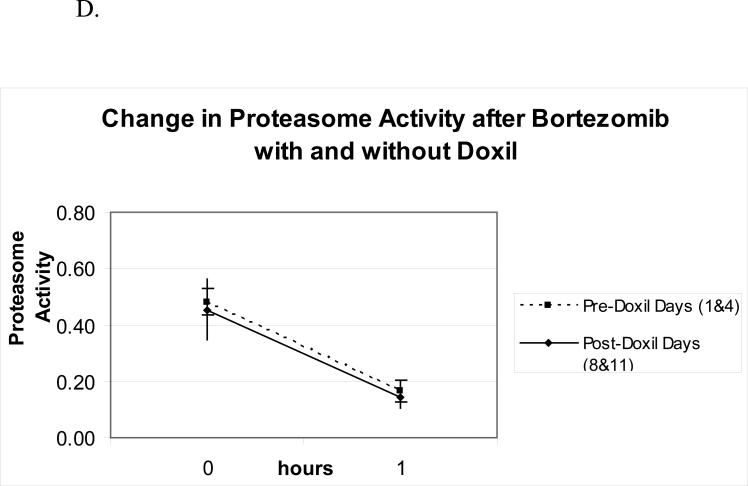
Figure 1.
Pharmacodynamics of bortezomib(B) and PLD. (A) Inhibition of the chymotryptic activity of the 20S proteasome by B is shown as a function of the administered dose level (in mg/m2). The mean percentage inhibition 1 hour after each dose compared to the pretreatment baseline is shown for days 1 and 4. All data presented are from the first cycle of therapy. (B) The mean 20S proteasome inhibition one hour after each dose B alone on days 1 and 4 is compared to mean inhibition on days 8 and 11, when both B and PLD were present. (C) Specific activity of the chymotrypsin like proteasome protease is shown at baseline and one hour after bortezomib treatment on day 1 as a mean for each dose level. The units for specific activity are picomoles of fluorescent chromophore released per second per milligram of total protein. (D) Mean proteasome activity is shown at baseline and one hour after dosing with either bortezomib alone (days 1 and 4) or bortezomib in the presence of PLD (days 8 and 11).


