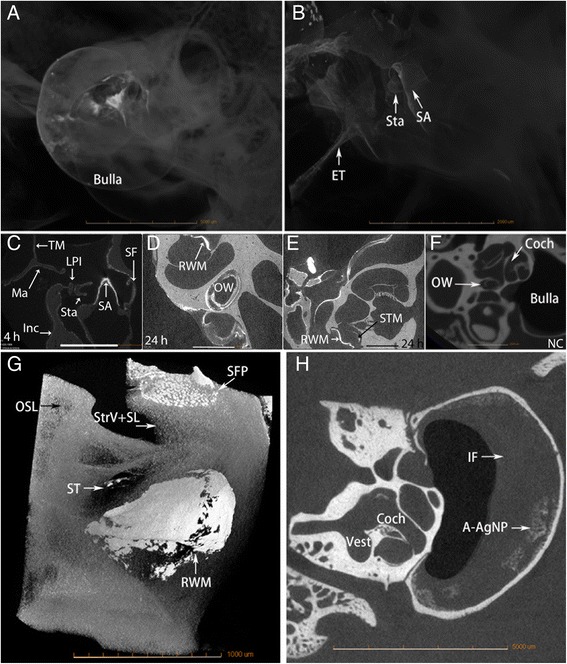
Figure 5.

Distribution of Ag NPs in the ear after transtympanic injection shown by micro CT. Either 370.7 mM (A-E, G) or 37.1 mM (H) of Ag NPs were injected at a volume of 50 μl. At 4 h post-administration (370.7 mM), AgNPs generated bright signal that appeared in the bulla, tympanic membrane (TM) Eustachian tube (ET), and the ossicular chain including malleus (Ma), incus (Inc) and stapes (Sta) (A-C). Abundant Ag NPs were found in the stapedial artery (SA) (C). At 24 h (370.7 mM), abundant distribution of AgNPs was detected in the round window membrane (RWM), oval window (OW), and scala tympani medial wall (STM) of the cochlea (D, E, G). On 7 d (37 mM), middle ear infiltration (IF) and AgNP aggregation (A-AgNPs) were observed (H). No Ag NPs were detected in the ear of non-treatment control (NC) (F). Coch: cochlea; LPI: lenticular process of incus; SF: stapes footplate; ST: scala tympani. Scale bars = 5 mm (A), 2 mm (B, F), 1 mm (C-E). A-F, H: 4x, Pixel size 21.8498; G: 10x, pixel size 1.7 um.
