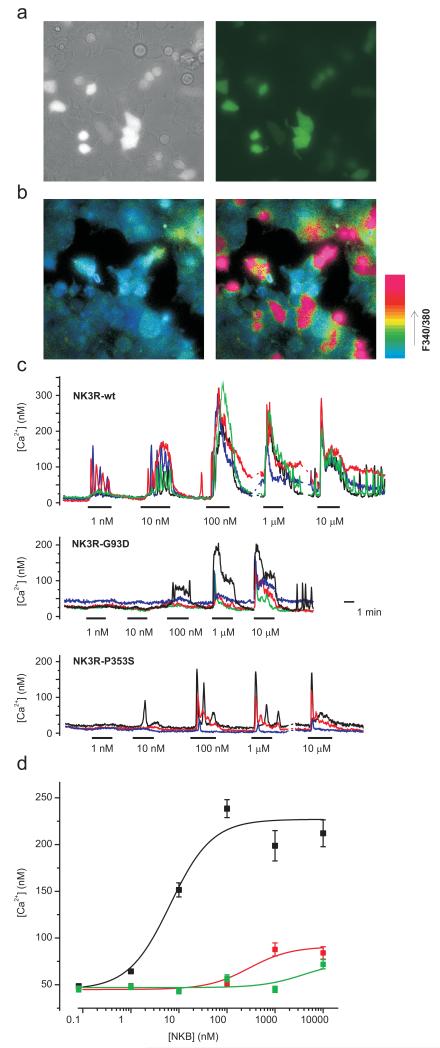
Figure 3.
Both missense mutations in NK3R result in loss of receptor function. A) Bright field (left) and GFP-fluorescent only (right) identifying TACR3 transfected HEK293 cells. B) Pseudocolour images of 340/380 nm ratio for the same optical field as in (A) before (left) and during (right) the application of 100 nM wt-NKB. Note that only GFP-positive cells respond. C) Representative Ca2+-responses of 3-5 wt- or mutant TACR3 transfected cells to application of different NKB doses as indicated. D) NKB dose responses for wt (black squares, n=93-206), G93D- (red squares, n=112-145) and P353S-mutant (green squares, n=156) TACR3. Peak [Ca2+]-responses recorded as in (C) in at least 5 dishes/construct were averaged over 30s and the data was fit with the logistic function [Ca2+] = (A1-A2)/(1+([NKB]/EC50))+A2 using origin software (Microcal). The resulting fit parameters were: wt-TACR3: A1=45±6 nM, A2=227±6 nM, EC50=6.6±1.3 nM; TACR3-G93D: A1=45±2 nM, A2=91±5 nM, EC50=290±146 nM; TACR3-P353S: A1=47±3 nM, A2=75 nM (fixed), EC50=4.0±2.1 μM. Error bars represent 1SE.

