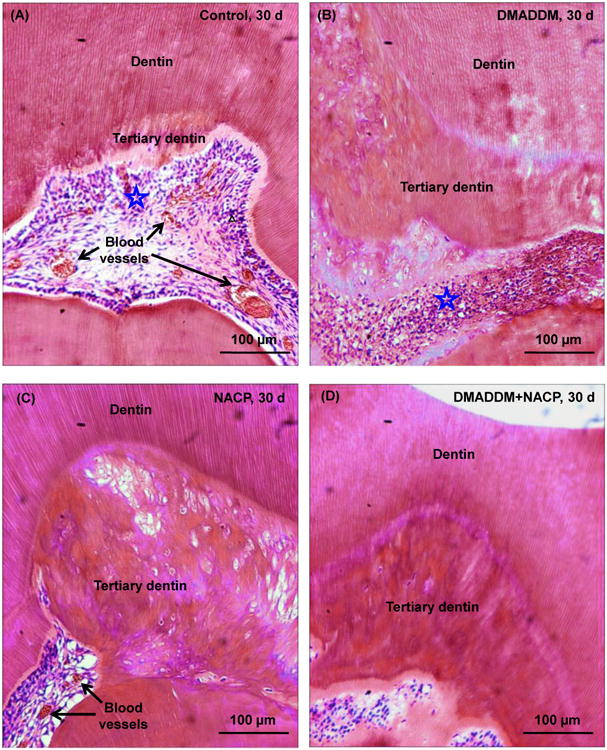
Figure 4.

Representative H&E images at 30 d: (A) Control group, (B) DMADDM group, (C) NACP group, and (D) DMADDM + NACP group. Stars indicate areas with inflammatory cells. Blood vessels are indicated by arrows. Control and DMADDM exhibited slight inflammatory responses. NACP and DMADDM+NACP showed normal pulp tissue without inflammatory response, and greater tertiary dentin thickness.
